Previous Issues Volume 1, Issue 1 - 2016
Serum levels of the Micronutrient Zinc Decrease with Advancing Age in Normally Nourished Older Adults Over 75 Years of Age
Michiyo Takahashi1, Toshikazu Suzuki1,2, Ayumi Takagi2, Hikaru Matsumoto1,2, Naotaka Hashizume3
1Graduate School of Human Ecology, Wayo Women's University, 2-3-1 Konodai, Ichikawa, Chiba 272-8533, Japan.
2Faculty of Life Science, Wayo Women's University, 2-3-1 Konodai, Ichikawa, Chiba, 272-8533, Japan.
3Faculty of Health Sciences, University of Human Arts and Sciences, 354-3, Shinshoji-Guruwa, Ota-aza, Iwatsuki-ku, Saitama 339-8555, Japan.
Corresponding Author:Toshikazu Suzuki, Department of Health and Nutrition, Wayo Women's University, 2-3-1 Konodai, Ichikawa, Chiba 272-8533, Japan. Tel: +81-43-371-1547; E-Mail: [email protected]
Received Date: 25 Apr 2016 Accepted Date: 25 May 2016 Published Date: 20 Jun 2016
Copyright © 2016 Suzuki T
Citation:Takahashi M, Suzuki T, Takagi A, Matsumoto H, et al. (2016). Serum levels of the Micronutrient Zinc Decrease with Advancing Age in Normally Nourished Older Adults Over 75 Years of Age. Mathews J Nutr Diet. 1(1): 005.
ABSTRACT
Adequate daily nutrient intake is one of the most important factors contributing to the achievement of healthy aging. In this study, we investigated changes in blood nutrients over a 2 years and 9 months period in normally nourished, independent- living, older adults who were over 75 years of age. Thirteen older adults (mean age 82.5 ± 5.2 years) participated in this study. Individual physical characteristics, nutritional status, dietary nutrient intake, and blood nutrient concentrations were measured in March 2009 and again in December 2011. The values of the anthropometric measurements, including height, weight, body mass index, mid-arm circumference, and calf circumference, decreased with advancing age. Estimated nutrient intakes revealed that all participants were well-nourished, although the estimated zinc intake of the male participants was slightly lower than the recommended dietary allowance. At the second measurement, in December 2011, serum zinc concentrations had decreased from March 2009 levels by 23% and 19% in the male and female participants, respectively. Our results imply that normally nourished older adults over 75 years of age may develop zinc insufficiency with increasing age. Increased dietary zinc intake and zinc supplementation might be important for older people, even if they are normally nourished based on dietary survey information.
KEYWORDS
Nutritional Assessment; Older Persons Over 75; Normally Nourished; Zinc.
INTRODUCTION
The number of older people in the world has been increasing at an unprecedented rate. According to the 2015 Revision of the World Population Prospects by the United Nations Population Division, the worldwide population estimates for people aged 60 years or over and aged 70 years or over (in the me dium-fertility population model) are 1.05 billion and 457 million in 2020, and 2.36 billion and 1.35 billion in 2060, respectively [1]. In Japan, the population estimates for people aged 60 years or over and aged 70 years or over are 42.9 million and 27.4 million in 2020, and 43.1 million and 31.3 million in 2060, respectively [1]. With these estimated increases in the population of older people, the need for lifestyle support and nursing care for the aging population is emerging as a pressing social issue, especially in developed countries such as Japan. There is a 7 to 9 years gap between life expectancy and healthy life expectancy [2]. Successful aging, including avoidance of disease and disability, maintenance of high physical and cognitive function, and sustained engagement in social and productive activities, is now an important public health focus [3]. Nutrition/diet quality is one of the major determinants of successful aging [4-6]. Poor nutritional status or low diet quality in older people is known to be an independent risk factor for progressive health decline, reduced physical and cognitive functional status, increased utilization of healthcare services, early institutionalization, and increased morbidity and mortality [7-9]. Various nutritional screening tools have been developed to allow early recognition of malnutrition or undernutrition in older adults; these include the Geriatric Nutritional Risk Index (GNRI), the Mini Nutritional Assessment (MNA), the Mini Nutritional Assessment Screening Form (MNA-SF), and the Malnutrition Universal Tool (MUST) [10-13]. In addition, recent studies have shown that nutrition/dietary patterns are associated with brain biomarkers of Alzheimer's disease and the rate of cognitive decline, suggesting the that dietary interventions may be an effective means of preventing Alzheimer's disease and cognitive impairment [14-16]. Other studies suggest the efficacy of dietary interventions for prevention of sarcopenia [17, 18]. Although older people eating a balanced diet might be assumed to be normally nourished, the rate of digestion and gastrointestinal absorption of nutrients may decrease with advancing age. Thus, older people may require a greater intake of certain nutrients than the current recommended dietary allowance (RDA) [19]. Additionally, few longitudinal studies have assessed the nutritional status of normally nourished older adults. Therefore, in this study we performed nutritional assessments of independent-living older adults over 75 years of age who were classified as normally nourished. All participants underwent two serum biochemistry analyses, the first in March 2009 and the second in December 2011. The serum concentrations of dietary nutrients were compared to identify which nutrient concentrations decreased during the 2-year and 9-month interval between the tests.
MATERIALS AND METHODS
A baseline study was conducted of 33 people who were members of a senior citizens'club in Ichikawa, Japan in March 2009, when the participants were mean age 78.3 ± 5.9 years, and follow-up study was subsequently conducted in December 2011. In the research describe here, analysis was conducted of 13 people (7 men and 6 women) who participated in both the baseline study and the study conducted 2 years and 9 months later, when they were mean age 82.5 ± 5.2 years. All of the analyzed subjects were healthy and were living independently, without receiving any special nursing care. Individual physical characteristics, including height, weight, body mass index (BMI), mid-arm circumference (MAC), and calf circumference (CC), were measured. Nutritional status was assessed with Mini Nutritional Assessment (MNA), which is a nutritional screening tool used worldwide [11]. The full MNA® has been validated to classify whether older adults have a "normal nutritional status", are "at risk for malnutrition", or are "malnourished". Score ranges of 24-30 points, 17-23.5 points, and 0-17 points correlate with normal nutritional status, at risk for malnutrition, and malnourished, respectively. A self-administered diet history questionnaire (DHQ) and brief self-administered diet history questionnaire were administered in March 2009 and December 2011, respectively, to further evaluate the nutritional status and dietary intake of the participants [20-22]. Blood samples were collected into anticoagulant- and geltreated tubes at 9-10 a.m. after an overnight fast for whole blood sample analysis and serum separation, respectively. Whole blood samples were used to determine hematological values and the hemoglobin A1c ratio. Blood samples in geltreated tubes were stored at room temperature for 30 min to allow the blood to clot. Serum was then separated by centrifugation at 1,500 × g for 10 min at 4°C, and the following serum parameters were measured: total protein, albumin, transthyretin, asparagine transaminase (AST), alanine transaminase (ALT), ?-glutamyltransferase (?-GT), cholinesterase, urea nitrogen, creatinine, uric acid, lipids, glucose, sodium, potassium, chlorine, calcium, magnesium, inorganic phosphorus, iron, zinc, folic acid, vitamin B12, and vitamin C concentrations. Biochemical measurements were performed by SRL Inc. (Tokyo, Japan). Data were analyzed by paired t-tests and regression analysis using Microsoft Excel 2013. Differences were considered statistically significant if P < 0.05. The study protocol was explained to the participants, and each participant gave their written informed consent prior to participation. This study was approved by the Wayo Women's University Human Ethics Committee (No. 0811 and 1103).
Table 1: Physical characteristics of the participants.
| Men (n=7) | Women (n=6) | ||||||
|---|---|---|---|---|---|---|---|
| Mar. 2009 | Dec. 2011 | P-value | Mar. 2009 | Dec. 2011 | P-value | ||
| Age | (year) | 79.6 ±6.0 | 82.1 ±6.0 | 1.0±10-5 | 80.0 ±3.7 | 82.8 ±3.8 | 1.0±10-5 |
| Height | (cm) | 159.4 ±3.4 | 158.9 ±3.2 | 0.016 | 147.8 ±3.9 | 147.3 ±4.0 | 0.065 |
| Weight | (kg) | 61.0 ±4.7 | 59.0 ±3.7 | 0.018 | 50.0 ±1.6 | 48.7 ±1.8 | 0.014 |
| BMI | (kg/m2) | 24.0 ±2.1 | 23.4 ±1.8 | 0.042 | 22.9 ±1.3 | 22.5 ±1.4 | 0.022 |
| MAC | (cm) | 29.8 ±2.5 | 27.0 ±1.8 | 0.015 | 27.9 ±1.2 | 25.6 ±1.1 | 0.001 |
| CC | (cm) | 35.7 ±1.5 | 34.5 ±1.6 | 0.009 | 33.2 ±0.6 | 32.0 ±0.9 | 0.009 |
| MNA | (point) | 26.6 ±1.7 | 27.6 ±1.0 | 0.267 | 26.7 ±2.1 | 27.5 ±1.5 | 0.323 |
Table 2: Estimated participant nutrient intakes.
| Men(n = 7) | Women (n = 6) | |||||||||||
|---|---|---|---|---|---|---|---|---|---|---|---|---|
| Mar. 2009 | Dec. 2011 | RDA | AI | DG | Mar. 2009 | Dec. 2011 | RDA | AI | DG | |||
| Energy | (kcal/day) | 2130.9±568.3 | 1950.7±502.4 | 2113.3±665.3 | 2251.8±602.8 | |||||||
| Protein | (g/day) | 75.8±25.0 | 72.7±18.0 | 60 | 79.5±31.5 | 95.7±39.4 | 50 | |||||
| (%Energy) | 14.1±1.7 | 15.1±1.6 | 13-20 | 14.7±1.6 | 16.5±3.7 | 13-20 | ||||||
| Lipid | (g/day) | 49.8±17.2 | 51.7±12.9 | 67.0±29.6 | 70.9±23.4 | |||||||
| (%Energy) | 20.9±4.2 | 24.6±5.4 | 20-30 | 27.3±4.1 | 28.2±3.7 | 20-30 | ||||||
| Saturated fatty acid | (g/day) | 12.9±4.7 | 14.8±4.5 | 19.2±7.5 | 19.6±5.4 | |||||||
| (%Energy) | 5.4 ±1.3 | 7.1 ±2.4 | ?7 | 8.0 ±1.2 | 7.9 ±0.8 | ?7 | ||||||
| Monounsaturated fatty acid | (g/day) | 15.5±5.3 | 17.7±4.7 | 22.9±10.6 | 24.8±8.7 | |||||||
| Polyunsaturated fatty acid | (g/day) | 11.9±3.9 | 11.9±2.8 | 15.7±8.1 | 16.6±6.5 | |||||||
| n-3 fatty acid | (g/day) | 2.6±0.9 | 2.7±0.8 | 2.2 | 3.0±1.6 | 3.6±1.7 | 1.9 | |||||
| n-6 fatty acid | (g/day) | 9.3±3.0 | 9.2±2.1 | 8 | 12.7±6.5 | 12.9±4.8 | 7 | |||||
| Cholesterol | (mg/day) | 319.2±172.9 | 378.7±166.0 | 324.9±138.2 | 567.3±233.1 | |||||||
| Carbohydrate | (g/day) | 324.7±90.6 | 262.7±55.6 | 293.5±82.1 | 300.0±87.4 | |||||||
| (%Energy) | 61.2 ±7.4 | 54.6 ±6.1 | 50-65 | 56.0 ±4.0 | 53.2 ±6.8 | 50-65 | ||||||
| Dietary fiber | (g/day) | 16.3±5.4 | 12.3±3.5 | ?19 | 19.6±8.2 | 19.1±7.4 | ?17 | |||||
| Vitamins | ||||||||||||
| Vitamin A | (μg/day) | 693.4±317.6 | 706.2±240.1 | 800 | 999.5±581.9 | 1216.5±517.4 | 650 | |||||
| Vitamin D | (μg/day) | 12.8±5.7 | 17.0±6.1 | 5.5 | 9.8±6.6 | 24.0±16.1 | 5.5 | |||||
| Vitamin E | (μg/day) | ND | 6.9±2.1 | 6.5 | ND | 10.7±4.3 | 6.0 | |||||
| Vitamin K | (μg/day) | 315.1±90.0 | 277.1±98.7 | 150 | 403.7±194.3 | 485.4±247.1 | 150 | |||||
| Vitamin B1 | (μg/day) | 0.8±0.3 | 0.7±0.2 | 1.2 | 1.1±0.5 | 1.1±0.4 | 0.9 | |||||
| Vitamin B2 | (μg/day) | 1.5±0.4 | 1.5±0.3 | 1.3 | 1.8±0.6 | 1.9±0.6 | 1.1 | |||||
| Niacin | (μg/day) | 17.2±5.9 | 16.7±5.6 | 13 | 18.1±9.5 | 20.2±10.3 | 10 | |||||
| Vitamin B6 | (μg/day) | 1.1±0.3 | 1.3±0.4 | 1.4 | 1.5±0.6 | 1.7±0.7 | 1.2 | |||||
| Folic acid | (μg/day) | 379.3±71.9 | 371.1±86.7 | 240 | 477.9±178.5 | 542.8±220.5 | 240 | |||||
| Vitamin B12 | (μg/day) | 11.2±4.9 | 12.1±4.0 | 2.4 | 12.5±9.7 | 14.0±9.9 | 2.4 | |||||
| Pantothenic acid | (mg/day) | 6.3±1.8 | 6.7±1.6 | 5 | 7.4±2.7 | 9.2±3.2 | 5 | |||||
| Vitamin C | (mg/day) | 133.7±42.3 | 134.3±42.6 | 100 | 203.2±100.8 | 212.7±95.8 | 100 | |||||
| Minerals | ||||||||||||
| Sodium | (mg/day) | 5088.5±1797.7 | 4830.3±1330.9 | 5038.9±1890.0 | 5547.6±1919.4 | |||||||
| (Salt equivalent) | (g/day) | 12.9 ±4.6 | 12.3 ±3.4 | < 8.0 | 12.8 ±4.8 | 14.1 ±4.9 | >< 7.0 | |||||
| Potassium | (mg/day) | 2436.1±685.5 | 2536.5±692.9 | 2,500 | ?3,000 | 3226.4±1236.2 | 3727.5±1412.9 | 2,000 | ?2,600 | |||
| Calcium | (mg/day) | 661.8±291.5 | 632.0±198.2 | 700 | 807.1±218.9 | 901.0±325.0 | 650 | |||||
| Magnesium | (mg/day) | 284.0±76.7 | 259.9±69.3 | 320 | 319.0±121.0 | 355.0±138.2 | 270 | |||||
| Minerals | ||||||||||||
| Phosphorus | (mg/day) | 1207.2±377.2 | 1103.3±279.6 | 1,000 | 1299.6±461.7 | 1512.9±589.6 | 800 | |||||
| Iron | (mg/day) | 8.8±2.5 | 8.3±1.8 | 7.0 | 9.7±4.0 | 11.6±4.6 | 6.0 | |||||
| Zinc | (mg/day) | 9.1±2.1 | 8.1±1.6 | 9 | 10.8±5.0 | 11.0±3.9 | 7 | |||||
| Copper | (mg/day) | 1.4±0.3 | 1.2±0.3 | 0.9 | 1.4±0.6 | 1.6±0.6 | 0.7 | |||||
| Manganese | (mg/day) | 5.4±1.2 | 4.1±0.8 | 4.0 | 5.3±1.0 | 4.4±1.6 | 3.5 | |||||
| All values are expressed as means ±SD. RDA: recommended dietary allowance (70 years and over), AI: adequate intake (70 years and over), DG: tentative dietary goal for preventing life-style related disease (70 years and over) [19]. | ||||||||||||
RESULTS
The physical characteristics of the participants are shown in Table 1. Height, weight, BMI, MAC, and CC significantly decreased between March 2009 and December 2011 in both men and women. All participants were considered well-nourished based on BMI, MAC, CC, and the full MNA® (score = 24 points) in December 2011. One female participant had been classified as at risk of malnutrition in March 2009; however, she was determined to have normal nutritional status in December 2011. The results of the self-administered DHQ (Table 2) revealed that the participants' estimated intakes of energy and protein, and energy ratios of carbohydrate and fat, met the standard dietary reference intake levels (2015) for Japanese people 70 years of age and older [19]. In the female participants, the estimated micronutrient intakes met the RDA for women 70 years of age and older in both March 2009 and December 2011. The male participants' estimated intakes of vitamins B1 and B6, calcium, and magnesium during both March 2009 and December 2011, and the estimated intake of zinc in December 2011, were slightly lower than the RDA for men 70 years of age and older. For other micronutrients, the estimated intakes of the male participants met the RDA for their age group. The red blood cell count, haematocrit, haemoglobin content, and serum levels of total protein, albumin, and iron did not significantly change over the 2 years and 9 months between measurements, although their values appeared to be declining (Table 3).
Table 3: Participant haematological and biochemical parameters.
| Men (n=7) | Women (n=6) | ||||||
|---|---|---|---|---|---|---|---|
| Mar. 2009 | Dec. 2011 | P-value | Mar. 2009 | Dec. 2011 | P-value | ||
| White blood cell count | (//μL) | 5357 ±1419 | 5314 ±1440 | 0.944 | 5817 ±948 | 5267 ±718 | 0.138 |
| Red blood cell count | (×104//μL) | 455 ±72 | 432 ±84 | 0.042 | 454 ±29 | 449 ±28 | 0.695 |
| Hemoglobin | (g/dL) | 14.2 ±1.8 | 13.7 ±2.2 | 0.070 | 13.7 ±0.5 | 13.7 ±0.9 | 0.934 |
| Hematocrit | (%) | 43.5 ±5.1 | 41.8 ±6.5 | 0.068 | 42.8 ±2.1 | 42.7 ±2.5 | 0.918 |
| Platelet count | (×10000//μL) | 24.8 ±4.6 | 22.7 ±4.2 | 0.087 | 22.6 ±6.0 | 21.4 ±5.4 | 0.214 |
| Total protein | (g/dL) | 7.6 ±0.6 | 7.4 ±0.5 | 0.217 | 7.5 ±0.4 | 7.4 ±0.6 | 0.621 |
| Albumin | (g/dL) | 4.5 ±0.4 | 4.3 ±0.4 | 0.168 | 4.5 ±0.3 | 4.4 ±0.4 | 0.610 |
| Transthyretin | (mg/dL) | 28.1 ±4.4 | 24.9 ±4.4 | 0.052 | 27.5 ±3.7 | 25.6 ±4.0 | 0.309 |
| AST | (U/L) | 21 ±2 | 21 ±3 | 0.914 | 25 ±5 | 25 ±5 | 0.934 |
| ALT | (U/L) | 15 ±6 | 16 ±6 | 0.588 | 22 ±13 | 23 ±13 | 0.627 |
| LDH | (U/L) | 186 ±30 | 173 ±42 | 0.060 | 225 ±35 | 205 ±27 | 0.093 |
| ?-GT | (U/L) | 31 ±21 | 32 ±23 | 0.805 | 26 ±18 | 24 ±16 | 0.216 |
| Cholinesterase | (U/L) | 332 ±45 | 302 ±44 | 2.7±10-4 | 340 ±46 | 323 ±47 | 0.319 |
| Urea nitrogen | (mg/dL) | 15.8 ±5.5 | 19.1 ±7.9 | 0.029 | 14.9 ±2.6 | 15.3 ±3.0 | 0.621 |
| Creatinine | (mg/dL) | 0.91 ±0.26 | 0.93 ±0.38 | 0.741 | 0.66 ±0.09 | 0.64 ±0.07 | 0.560 |
| Uric acid | (mg/dL) | 5.6 ±0.8 | 5.5 ±0.8 | 0.775 | 5.0 ±0.7 | 4.8 ±0.6 | 0.588 |
| Triglycerides | (mg/dL) | 124 ±37 | 102 ±52 | 0.121 | 94 ±33 | 88 ±20 | 0.601 |
| HDL cholesterol | (mg/dL) | 57 ±25 | 58 ±24 | 0.655 | 67 ±13 | 60 ±8 | 0.186 |
| LDL cholesterol | (mg/dL) | 129 ±48 | 94 ±36 | 0.044 | 142 ±28 | 128 ±21 | 0.224 |
| Glucose | (mg/dL) | 104 ±22 | 107 ±18 | 0.304 | 106 ±17 | 110 ±17 | 0.485 |
| Hemoglobin A1c | (%) | 5.3 ±0.6 | 5.3 ±0.6 | 0.356 | 5.5 ±0.5 | 5.6 ±0.3 | 0.419 |
| Sodium | (mEq/dL) | 141 ±2 | 143 ±2 | 0.086 | 143 ±1 | 142 ±1 | 0.415 |
| Potassium | (mEq/dL) | 4.6 ±0.4 | 4.4 ±0.3 | 0.145 | 4.4 ±0.5 | 4.2 ±0.2 | 0.157 |
| Chlorine | (mEq/dL) | 103 ±3 | 106 ±3 | 0.009 | 104 ±2 | 106 ±2 | 0.205 |
| Calcium | (mg/dL) | ND | 9.5 ±0.4 | - | ND | 9.4 ±0.3 | - |
| Magnesium | (mg/dL) | ND | 2.2 ±0.2 | - | ND | 2.4 ±0.1 | - |
| Inorganic phosphorus | (mg/dL) | ND | 3.1 ±0.4 | - | ND | 3.6 ±0.4 | - |
| Iron | (μg/dL) | 113 ±42 | 103 ±28 | 0.497 | 101 ±33 | 88 ±22 | 0.287 |
| Zinc | (μg/dL) | 90 ±17 | 69 ±11 | 0.002 | 98 ±7 | 79 ±10 | 0.002 |
| Folic acid | (ng/mL) | 8.6 ±2.2 | 5.9 ±1.8 | 0.137 | 9.3 ±2.4 | 6.6 ±1.8 | 0.027 |
| Vitamin B12 | (pg/mL) | 680.1 v210.8 | 498.9 ±267.3 | 0.078 | 973.8 ±389.0 | 499.7 ±104.0 | 0.038 |
| Vitamin C | (μg/ml) | 10.7 ±3.7 | 8.0 ±2.7 | 0.052 | 13.7 ±3.6 | 9.5 ±3.0 | 0.022 |
| All values are expressed as means ±SD. | |||||||
Serum levels of glucose, lipids, creatinine, urea nitrogen, uric acid, and HbA1c, and activities of marker enzymes were unchanged and in the reference range, suggesting that the participants had been in a relatively good health condition for their age for 2 years and 9 months. Serum levels of vitamin C and zinc levels in both men and women, and serum levels of folic acid and vitamin B12 in women, declined significantly between the two tests, although their levels, except for serum zinc, were still above the mid-value of the reference range. The serum zinc concentrations were less than the mid-reference range value (87.5 μg/dL; reference range = 65-110 μg/ dL) in December 2011 in 11 of the 13 participants (6 men and 5 women) (Figure 1).
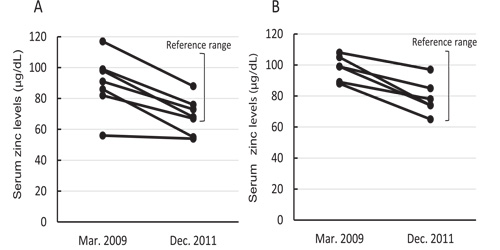
Figure 1: Changes in serum zinc levels in men (A) and women (B). The reference range for serum zinc concentrations in male/female adults was 65-110 μg/dL.
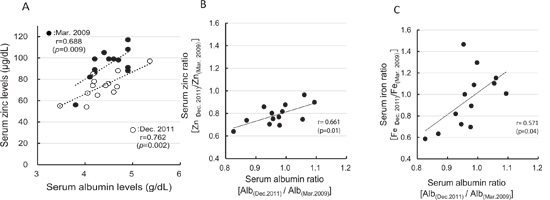
Figure 2: Associations of serum albumin with serum zinc and iron concentrations. A: Correlation between serum albumin and serum zinc concentrations. B: Correlation between serum albumin ratio [Alb(Dec. 2011)/Alb(Mar. 2009)] and the serum zinc ratio [Zn(Dec. 2011)/Zn(Mar. 2009)]. C, Correlation between serum albumin ratio [Alb(Dec. 2011)/Alb(Mar. 2009)] and the serum iron ratio [Fe(Dec. 2011)/Fe(Mar. 2009)].
In the male participants, the average serum levels of zinc in December 2011 were near the lower limit of the reference range (Table 3). A correlation between serum zinc levels and serum albumin levels has been shown in a previous crosssectional study [23, 24]; our results also confirmed the same correlation (Figure. 2A). However, the position of the regression line for serum zinc versus albumin in December 2011 was lower than for this relationship in March 2009. Furthermore, greater decreases in serum albumin between the two measurements were associated with greater decreases in the serum zinc ratio [Zn(Dec. 2011)/ Zn(Mar. 2009)] (Figure 2B). A similar phenomenon was observed in the correlation between serum albumin ratio [Alb(Dec.2011)/Alb(Mar. 2009)] and the serum iron ratio (Figure 2C); however, serum iron levels decreased in only six participants and the correlation coefficient was lower than that between serum albumin levels versus the serum zinc ratio. These results indicate that the decline in the serum zinc concentration precedes the decrease in serum albumin levels.
DISCUSSION
In this study, we found that serum concentrations of folic acid, vitamin B12 and C, and zinc decreased over a 2-year and 9-month period in normally nourished participants over 75 year of age (Table 3). This suggests that older people might be prone to micronutrient insufficiency. In particular, the decrease in serum zinc concentrations in older men may have adverse effects because zinc levels decreased to the lower limit of the reference range. We also confirmed that serum albumin declined more with greater decreases in serum zinc (Figure. 2B). Other micronutrients that are essential for successful aging, such as vitamins B1, B6, and D, may also decrease with aging, although we did not assess these micronutrients in the study [25-27]. Zinc is an essential trace element required for many cellular processes, including cell proliferation, normal development, and maintenance of normal immune responses [28]. Multiple studies worldwide have reported age-associated declines in blood zinc levels [29, 30]. Such declines in serum zinc levels may reduce immunocompetence, leading to an increased susceptibility to certain infectious and age-related diseases. One report suggested that older adults who consumed an adequate amount of zinc in their food were able to maintain serum zinc levels, but had elevated urinary zinc excretion compared with middle-aged people [31]. However, that finding was based on a cross-sectional study and to our knowledge no previous longitudinal studies reporting an age-associated decline in serum zinc levels exist. Several factors affect serum zinc levels; these include dietary zinc intake as well as zinc absorption and excretion. Dietary zinc intake in men was slightly, but not significantly, less in December 2011 than in March 2009. However, this was not the case in the female participants, which suggests that age-associated reductions in absorption and/or increased excretion of zinc may affect serum zinc levels more severely than zinc intake in normally nourished older adults. Further investigation into the mechanism underlying the rapid decline in serum zinc levels in adults over 75 years of age is needed. Although the average serum zinc concentrations in December 2011 were within the reference range in both men and women, it is likely that a further decline would occur with increasing age. If so, zinc insufficiency or deficiency might occur in older adults even if they apparently consume an adequate amount of zinc in their diet. Because decreases in serum zinc concentrations were associated with decreases in serum albumin levels, and because zinc deficiency may play a major role in age-associated dysregulation of immune function and chronic low-grade systemic inflammation, prevention of zinc insufficiency by dietary zinc supplementation may be an effective means of delaying senescence and achieving healthy aging [23,24,32]. In mice, zinc supplementation has been shown to reduce ageassociated inflammation [33]. Individuals with the G/G variant of the IL-6 -174G/C locus (rs1800795) have been suggested to be more prone to age-related inflammatory pathologies, impaired innate immune responses, and low zinc availability compared with those with the C/C and C/G variants [34]. Because all Asian people are G/G allele carriers, Japanese people (including the participants in this study) might be more likely to need zinc supplementation than European people, in whom the ratio of G/G allele carriers is approximately 25% [35]. Our results suggest that older adults over 75 years of age might become susceptible to zinc insufficiency with increasing age, even if they are normally nourished. Preservation of serum zinc levels may be an effective means of preventing a decline in serum albumin levels. Therefore, increased zinc intake from zinc-fortified foods and supplements might be important even for older adults who are normally nourished as assessed by dietary survey. Further study of the association between zinc concentrations and physical condition/independence should be pursued.
CONCLUSION
Our findings suggest that normally nourished adults over 75 years of age may become susceptible to zinc insufficiency with increasing age. Increased dietary zinc intake and zinc supplementation might be important for older people to achieve successful aging.
Acknowledgments
This work was supported in part by a research grant from Kao Research Council for the Study of Healthcare Science (TS).
COMPETING INTERESTS
The authors declare that they have no competing interests.
AUTHORS' CONTRIBUTIONS
MT was involved in the design of the original study, data acquisition and analysis, and manuscript preparation. TS was involved in the design of the original study, data acquisition and analysis, and manuscript preparation. AT was involved in data acquisition and analysis. NH and HM were involved in the conception and design of the study, data acquisition and interpretation, and manuscript preparations. All authors read and approved the final manuscript.
REFERENCES
- United Nations. (2015). Probabilistic Populations based on the World Population Prospects: The 2015 Revision.
- GBD 2013 DALYs and HALLE Collaborators, Murray CJ, Barber RM, Foreman KJ, Abbasoglu Ozgoren A, et al. (2015). Global, regional, and national disability-adjusted life years (DALYs) for 306 diseases and injuries and healthy life expectancy (HALE) for 188 countries, 1990-2013: quantifying the epidemiological transition. Lancet. 386, 2145-2191.
- Rowe JW and Kahn RL. (1997). Successful aging. Gerontologist. 37(4), 433-440.
- Gaudreau P, Morais JA, Shatenstein B, Gray-Donald K, et al. (2007). Nutrition as a determinant of successful aging: description of the Quebec longitudinal study Nuage and results from cross-sectional pilot studies. Rejuvenation Res. 10(3), 377-386.
- Harmell AL, Jeste D and Depp C. (2014). Strategies for successful aging: a research update. Curr Psychiatry Rep. 16(10), 476.
- Rahi B, Morais JA, Dionne IJ, Gaudreau P, et al. (2014). The combined effects of diet quality and physical activity on maintenance of muscle strength among diabetic older adults from the NuAge cohort. Exp Gerontol. 49, 40-46.
- Kiefte-de Jong JC, Mathers JC and Franco OH. (2014). Nutrition and healthy ageing: the key ingredients. Proc Nutr Soc. 73(2), 249-259.
- Kagansky N , Berner Y, Koren-Morag N, Perelman L, et al. (2005). Poor nutritional habits are predictors of poor outcome in very old hospitalized patients. Am J Clin Nutr. 82(4), 784- 791.
- Parrott MD, Shatenstein B, Ferland G, Payette H, et al. (2013). Relationship between diet quality and cognition depends on socioeconomic position in healthy older adults. J Nutr. 143(11), 1767-1773.
- Cereda E and Pedrolli C. (2009). The Geriatric Nutritional Risk Index. Curr Opin Clin Nutr Metab Care. 12(1), 1-7.
- Vellas B, Guigoz Y, Garry PJ, Nourhashemi F, et al. (1999). The Mini Nutritional Assessment (MNA) and its use in grading the nutritional state of elderly patients. Nutrition. 15(2), 116-122.
- Rubenstein LZ, Harker JO, Salva A, Guigoz Y, et al. (2001). Screening for undernutrition in geriatric practice: developing the short-form mini-nutritional assessment (MNA-SF). J Gerontol A Biol Sci Med Sci. 56(6), 366-372.
- Russell CA and Elia M. (2010). Malnutrition in the UK. Where does it begin? Proc Nutr Soc. 69(4), 465-469.
- Berti V, Murray J, Davies M, Spector N, et al. (2015). Nutrient patterns and brain biomarkers of Alzheimer�s disease in cognitively normal individuals. J Nutr Health Aging. 19(4), 413-423.
- Tangney CC, Li H, Wang Y, Barnes L, et al. (2014). Relation of DASH- and Mediterranean-like dietary patterns to cognitive decline in older persons. Neurology. 83(16), 1410-1416.
- Wengreen H, Munger RG, Cutler A, Quach A, et al. (2013). Prospective study of Dietary Approaches to Stop Hypertension- and Mediterranean-style dietary patterns and age-related cognitive change: the Cache County Study on Memory, Health and Aging. Am J Clin Nutr. 98(5), 1263-1271.
- Bosaeus I and Rothenberg E. (2015). Nutrition and physical activity for the prevention and treatment of age-related sarcopenia. Proc Nutr Soc. 1(2), 1-7.
- Paddon-Jones D and Rasmussen BB. (2009). Dietary protein recommendations and the prevention of sarcopenia. Curr Opin Clin Nutr Metab Care. 12(1), 86-90.
- Ministry of Health, Labor and Welfare, Japan. Overview of Dietary Reference Intakes for Japanese (2015).
- Sasaki S, Yanagibori R and Amano K. (1998). Self-administered diet history questionnaire developed for health education: a relative validation of the test-version by comparison with 3-day diet record in women. J Epidemiol. 8(4), 203-215.
- Kobayashi S, Honda S, Murakami K, Sasaki S, et al. (2012). Both comprehensive and brief self-administered diet history questionnaires satisfactorily rank nutrient intakes in Japanese adults. J Epidemiol. 22(2), 151-159.
- Kobayashi S, Murakami K, Sasaki S, Okubo H, et al. (2011). Comparison of relative validity of food group intakes estimated by comprehensive and brief-type self-administered diet history questionnaires against 16 d dietary records in Japanese adults. Public Health Nutr. 14(7), 1200-1211.
- Goda F, Inukai M, Okuyama H, Himoto T, et al. (2010). The feasibility study of the necessity of supplementations of trace elements in healthy elderly subjects. J Jpn Soc Parenter Enteral Nutr. 25, 823-829.
- Kikunaga S and Kosaka K. (2013). The relationship between zinc nutritional status and physical function in the elderly. Trace Nutrients Res. 30, 101-109.
- Koh F, Charlton K, Walton K and McMahon AT. (2015). Role of dietary protein and thiamine intakes on cognitive function in healthy older people: a systematic review. Nutrients. 7(4), 2415-2439.
- Schottker B and Brenner H. (2015). Vitamin D as a Resilience Factor, Helpful for Survival of Potentially Fatal Conditions: A Hypothesis Emerging from Recent Findings of the ESTHER Cohort Study and the CHANCES Consortium. Nutrients. 7(5), 3264-3278.
- Selhub J, Troen A and Rosenberg IH. (2010). B vitamins and the aging brain. Nutr Rev. 68 Suppl 2, S112-118.
- Chasapis CT, Loutsidou AC, Spiliopoulou CA and Stefanidou ME. (2012). Zinc and human health: an update. Arch Toxicol. 86(4), 521-534.
- Hotz C, Peerson JM and Brown KH. (2003). Suggested lower cutoffs of serum zinc concentrations for assessing zinc status: reanalysis of the second National Health and Nutrition Examination Survey data (1976-1980). Am J Clin Nutr. 78(4), 756-764.
- Kogirima M, Kurasawa R, Kubori S, Sarukura N, et al. (2007). Ratio of low serum zinc levels in elderly Japanese people living in the central part of Japan. Eur J Clin Nutr. 61(3), 375-381.
- Andriollo-Sanchez M, Hininger-Favier I, Meunier N, Toti E, et al. (2005). Zinc intake and status in middle-aged and older European subjects: the ZENITH study. Eur J Clin Nutr. 59 Suppl 2, S37-41.
- Cabarera AJ. (2015). Zinc, aging, and immunosenescence: an overview. Pathobiol Aging Age Relat Dis. 5, 25592.
- Wong CP, Magnusson KR and Ho E. (2013). Increased inflammatory response in aged mice is associated with age-related zinc deficiency and zinc transporter dysregulation. J Nutr Biochem. 24(1), 353-359.
- Giacconi R, Cipriano C, Albanese F, Boccoli G, et al. (2004). The -174G/C polymorphism of IL-6 is useful to screen old subjects at risk for atherosclerosis or to reach successful ageing. Exp Gerontol. 39, 621-628.
- dbSNP ShortGenetic Variations. National Centor for Biotechnology Information U.S. National Library of Medicine.