Previous Issues Volume 3, Issue 1 - 2018
On Assessing Chromium, Cobalt and Nickel Nutritional Status by Analyzing Their Hair Frequency Distribution with a Median Derivatives Bioassay
Momcilovic B1 , Prejac J2 , Morovic S3 , Brundić S1 , Celebic A4 , Skalny AV5 , Mimica N6
1Institute for Research and Development of the Sustainable Ecosystems (IRES), Srebrnjak 59, 10000 Zagreb, Croatia. 2University Hospital Centre Zagreb, Department of Oncology, Kišpatićeva 12, 10000 Zagreb, Croatia. 3Aviva Medical Center, Nemetova 2, 10000 Zagreb, Croatia. 4University of Zagreb, School of Dental Medicine, Gundulićeva 5, 10000 Zagreb, Croatia. 5RUDN University, Miklukho-Maklaya str. 6, Moscow 117198, Russia. 6University Psychiatric Hospital Vrapče, Bolnička cesta 32, 10090 Zagreb, Croatia.
Corresponding Author: Berislav Momčilović, Institute for Research and Development of the Sustainable Ecosystems (IRES), Srebrnjak 59, 10000 Zagreb, Croatia, Tel: +385 1 2430288; Email: [email protected] ABSTRACT
The accurate assessment of the bioelement’s nutritional status is a condition sine qua non for judicious usage of the hair multi bioelement profiles in personalized medical practice. The term bioelement includes major elements and electrolytes, trace elements, and ultra-trace elements, since all of them are simultaneously entangled in the biological matrices of the hair and other tissues. This article aim to provide evidence on how hair is a suitable long- term biological indicator for the assessment of the nutritional status of cobalt, chromium, and nickel in the human body. Hair was collected from 1073 healthy adult subjects (339 Men, 734 Women). Hair samples were analyzed for their Co, Cr, and Ni content with the ICP-MS at the Center for Biotic Medicine, Moscow, Russia, and an ISO certified commercial laboratory for analyzing bioelements in the biological matrices. The log-transformed hair Co, Cr, and Ni frequency distribution data were statistically analyzed with the median derivatives bioassay. The generated bioassay sigmoid curves for Co, Cr, and Ni have a central linear range of concentrations that covers about 75% of the tested population. The observed linear segment of the sigmoid power curve (r2 ≥ 0.90) represents the adequate bioelement nutritional status where the deposition of a bioelement into the hair is linearly proportional to the hair follicle uptake of the available bioelement. The concentrations below that linear range were considered to be deficient and those above it as excessive, respectively. We have estimated that the adequate nutritional ranges provided by the hair analysis are (μg∙g-1): Co (♂ 0.006 – 0.022, ♀ 0.01 – 0.10); Cr (♂ 0.212 – 0.867, ♀ 0.189 – 0.626); and Ni (♂0.006 – 0.048, ♀0.150 – 0.926). Our assessment of the bioelement nutritional status is based on what was absorbed from the diet and what was actually incorporated into the protein (keratin) biological matrix of the human hair. The proposed bioassay is a promising tool for assessing the Co, Cr, and Ni nutritional status in medical practice, and for the study in the nutritional epidemiology of the vulnerable population groups like infant’s children and pregnant and lactating women. KEYWORDS: Bioelements; Nutritional Status; Hair; Whole Blood; Median Derivatives Bioassay; Cobalt, Chromium, Nickel. BACKGROUND Modern medical textbooks focus on nutrition since the nutrients, like bioelements, do affect the expression of our genes [1]. The term bioelement covers major elements and electrolytes, trace elements, and ultra-trace elements, both essential and nonessential, since all of them are simultaneously entangled in the biological fabrics of our tissues [2]. About the turn of this century, the Institute of Medicine, Washington DC, USA, started publishing a set of Dietary Reference Intakes (DRI) which guided us on how much of the nutrients, including bioelements, we are consuming from our diet, and how much of them we need to eat to be healthy and well nourished. These reports also provided DRI guidelines with regard to the age, gender, and vulnerable population groups of infant, children, and pregnant and lactating women [3-6]. Regardless of the fact of how valuable are Dietary Reference Intakes, they do not provide the data about the bioelement nutritional status of our bodies. Practicing health professionals need reliable guidelines for assessing the bioelement nutritional status, so that the wealth of the bioelement data that has accumulated over the decades of research, can find their adequate health application. The article aims is to assess the nutritional status of the supposedly essential trace elements Co, Cr, and Ni [7, 8] by analyzing their frequency distribution in the hair with a median derivatives bioassay [2]. In the series of our research studies, we have demonstrated how the frequency distribution of bioelements in the hair may be used for the assessment of the bioelement nutritional status for essential, semi-essential, and non- essential bioelements [2]. We have used the term semi-essential to denote the bioelements that show important biochemical activities, but which do not fulfill all the necessary requirements needed to be qualified as essential [9]. Hair is a protein keratin polymer [10], which is easily collected, the collection process is painless, and the collected samples are easily stored and transported to the places where sophisticated analytical equipment and trained personnel are available. Moreover, hair contains all the bioelements that may be found in our diet and environment (Figure.1). Indeed, bioelements are present in hair in distinct proportions and mutual inter-relationships, respectively [11]. Hair is a prima vista long-term biological indicator tissue for assessing the body bioelement nutritional status; a cumulative log of all the bioelement metabolic activity changes over a months. Hair growth is linear, and in difference to the short-term biological indicators of blood and urine, it does not have to equilibrate with the surrounding tissues. There are about 100 000 hair follicles on the human head, and their number declines as one ages. Hair grows at a constant rate of about 1 cm per month (0.3 mm per day), it is about 0.075 mm wide, and tends to curls when one side of the hair tread is growing faster than the other. Hair growth is cyclic and not constant; it goes from the active growth phase (anagen) to the period of growth rest phase (telogen) [12, 13]; at any moment about 10% of hair is in its resting telogen phase [14]. Details on how this go-rest-go cycle system is controlled is not yet known.
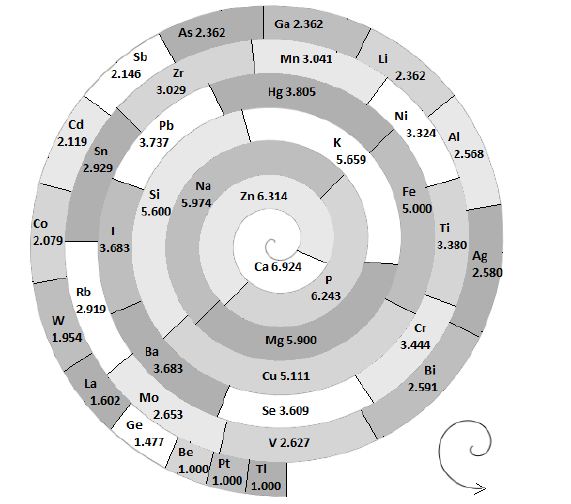
Figure1: Bioelements entagled in the shape of hair (log μg∙g-1).
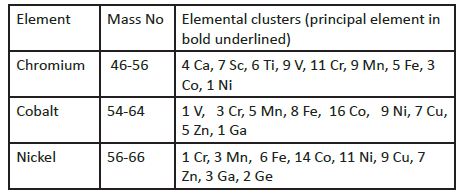
Cobalt, chromium, and nickel are considered to be the essential bioelements [15-20]; like the other essential bioelements, the departure from an adequate nutritional intake may induce either deficiency or excess, respectively. Deficiency of cobalt is accompanied with pernicious anemia, anemia that is characterized by the appearance of the large erythrocytes combined with the lack of an intrinsic factor that is needed to help Co absorption by the body [20], Thus far, no such associated clinical health deficiency states were observed for Cr and Ni [5], but some doubt arose about their respective essentiality [21]. There are strict safety standards on how much cobalt and chromium should be allowed in the solutions for the prolonged human total parenteral nutrition [22, 23], but only animal experimental data were reported for nickel [7, 8, 24]. All three enumerated bioelements may be absorbed by the skin [25] and are toxic to the skin [26, 27]. They may induce allergic reactions accompanied with dermatitis (Ni;>Cr;>Co) [26,28] they are a common constituent of dental and orthopedic alloy implants [20, 29-32], and all three of them are cancerogenic (Ni>Cr>Co) [33-36]; cardiotoxicity of Co and Ni is also well documented [37]. The understanding of such simultaneous and diverse biological properties of Co, Cr, and Ni, i.e., of being essential, allergogenic, cancerogenic, and cardiotoxic, requires further elucidation [38]. Distribution of bioelements within the body after they have been absorbed followed the Fick principle of diffusion, so that concentration of bioelements may differ from organ to organ, and tissue to tissue [39]. Moreover, the elimination rate of the different bio-elements from the human body is also different. In this article we have used the nomenclature terms proposed by the Institute of Medicine, Washington DC, for defining requirements [4, 5], where the reference values, collectively called the Dietary Reference Intakes (DRIs), include the Estimated Average Requirements (EAR), Recommended Dietary Allowances (RDA), Adequate Intake (AI), and Tolerable Upper Intake Level (UL). A requirement is defined as the lowest continuing intake level of a nutrient that will maintain a defined level of nurture in an individual [4, 5]. Adequate Intakes (AI) for adult men (M) and women (W) according to the Institute of Medicine [4, 5] are (μg∙day-1): Chromium for 19-50 years: M 35, W 25; Chromium for 51 -70+ yr; M 30, W 20; Cobalt M 4.5, W 3. For Nickel, only the Upper limit (UL) was set for adults of both sexes. The estimated Cr intake of adult men was estimated to be 35 μg∙day-1 (range 13-36 μg∙day-1), and the chromium intake for women was 25 μg∙day-1 (range 13-36 μg∙day-1) [40]. Somewhat different daily exposure estimates were recommended by the British Group on Vitamin and Minerals [41]. They set safe upper limits of the mean for Vitamins and Minerals (arithmetic mean; 97.5% percentiles) at: Co 0.012 (0.019) mg; Cr 0.1 (0.17) mg; and Ni 0.13 (0.21) mg. The median consumption of nickel for adults and the elderly in the USA was approximately 74 – 100 μg∙d-1 and 80-97 μg∙day-1, respectively [5]. Canadian data for all the adults were 201 406 μg∙day-1 [42]. Currently, the deficient levels of Co, Ni and Cr dietary intake are not defined [4, 5]. However, the Dietary Reference Intakes for Vitamin B12 [4] and Cr [5] are established, whereas for Ni we have only the upper limits (UL). The Ni upper limits were established after elaborate calculations where a conversion factor was deemed necessary to allow for the transfer of nutritional data from animal to humans and the data from the animal reproduction studies and animal fecundity [5]. In a series of experiments that thus far we have conducted, we have demonstrated how the nutritional status of both essential and non essential bioelements may be assessed by their hair frequency distribution analysis with the median derivatives bioassay [2]. The aim of this article is to assess the nutritional status of cobalt (Co), chromium (Cr), and nickel (Ni) in the occupationally non-exposed general population of both sexes in Croatia. SUBJECTS AND METHODS This prospective, observational, cross-sectional, and the exploratory epidemiological study was approved by the Ethical Committee of the Institute for Research and Development of the Sustainable EcoSystems (IRES), Zagreb, Croatia. The study was conducted by adherence to the Declaration of Helsinki on Human Subject Research [43]. Every subject gave his/her written consent to participate in the study and filled out a short questionnaire on his/her health status and medical history (data not shown) [44]. Data on hair shampooing were also recorded and none of them declared the presence of elements under the observation. Hair chromium, cobalt and nickel were analyzed in a random sample of 1073 apparently healthy adults (339 men, 734 women). Whole blood was analyzed in a subset of 233 subjects (142 women and 91 men); the median age of women and men was 47 and 50 years, respectively. Our population consisted of subjects from the general Croatian population who were interested in learning about their health status; the majority of them were living in the capital city region of Zagreb, Croatia. All the subjects consumed their usual home prepared mixed mid-European diet, and none of them have reported an adverse medical health condition. Hair Co, Cr and Ni and whole blood Co, Cr, and Ni were analyzed with the inductively coupled plasma mass spectrometry (ICP-MS, Elan 9000, Perkin Elmer, USA) at the Center for Biotic Medicine (CBM), Moscow, Russia (Appendix 1). The CBM is an ISO Europe certified commercial laboratory for analyzing bioelements (electrolytes, trace elements, and ultra-trace elements) in different biological matrices in health and disease. CBM is also a member of the exclusive External Quality Assessment of the Surrey scientific group for the quality control of trace element analysis. Hair Co, Cr, and Ni analysis was performed following the International Atomic Energy Agency recommendations [45] and other validated analytical methods and procedures [46]. Preparation of hair and whole blood for the ICP-MS analysis is described in Appendix 2: Part A for hair and Part B for the whole blood. The detection limits for Co, Cr, and Ni in the hair and whole blood were (ng∙g-1): Co 0.48; Cr 66.9; and Ni 2.1, respectively. All chemicals were of pro analysis grade (Khimmed Sintez, Moscow, Russia). Cobalt, chromium and nickel belong to the pleiad of bioelements that share the same mass number (number of isotopes/name of the element) (Table 1) [47].
Table 1: Chromium, cobalt, and nickel isotope Pleiades [47].
MEDIAN DERIVATIVES BIOASSAY The frequency distribution of cobalt, chromium, and nickel in the hair and whole blood samples was analyzed with the median derivative bioassay of the log-transformed data when the Gaussian frequency distribution pattern was generated and central limit theorem re-established [48]. To investigate the respective hair and whole blood cobalt, chromium, and nickel concentration frequency distribution, we used the median derivative bioassay to fit the sigmoid logistic regression function (power function) for men and women separately (Appendix 3): A2 + (A1 – A2)/ [1+(x/x0) p] Where A1 is the initial value (lower horizontal asymptote), A2 is the final value (upper horizontal asymptote), x0 is the center (point of inflection) is the median (M0 detected), p is power (the parameter that affects the slope of the area about the inflection point) (Appendix 2). The OriginPro 8.0 data analysis and graphing software was used for this analysis (OriginLab Corp., OriginPro Version 8.0., Northhampton, MA). The bioassay sigmoid curves of hair log-transformed bioelement concentration data belong to the Michaelis-Menten family of saturation kinetics bioassay models [49]. Such models are widely used in pharmacology, toxicology, and radiotoxicology, and the semantic terminology of describing such logistic curves is well known [50-54]. Thus, (a) there is a random dispersion of the available bioelements below the linear range segment of the power law sigmoid curve (Co, Cr, and Ni in this case), and below the threshold level; (b) the hair bioelement deposition (response) is linear and proportional to the available bioelement concentration, and (c) at high bioelement concentrations only small further increases in hair bioelement deposition can be achieved by increasing the available bioelement concentrations (the high level) [51]. These three steps are visually evident zones of the sigmoid curves for Co, Cr, and Ni (and other studied bioeelements. The deposition of a bioelement below the linear segment range denotes a deficient bioelement uptake by the hair; that bioelement concentrations which fall within the linear range segment indicate safe and adequate hair bioelement uptake, and the bioelement concentrations above the linear range segment of the sigmoid power curve denotes excessive level of hair bioelement uptake. We have already proposed that the adequate, i.e., linear segment of the sigmoid power curve, may be further subdivided into low adequate, safe, and high adequate linear range of the sigmoid power curve in a 60:30:10 ratio [2]. Indeed, even health and normality of man can be present without optimal development having taken place as balanced nutrition can occur at various levels of the nutrients and sparse diets are not necessarily deficient ones, although they often are [38, 55]. RESULTS The first step in our frequency distribution analysis was to logtransform the data and to correct for the skew and kurtosis of the data by re-establishing of the Gaussian distribution which follows the central limit theorem (Figure.2) [48]. The hair median concentrations (μg∙g-1) were the lowest for Co (Men 0.014, Women 0.028); those for Ni were higher (Men 0.351 Women 0.265); and the highest median concentrations were observed for the hair Cr (Men 0.397, Women 0.317). Evidently, hair contained much more Co, Ni, and Cr than the whole blood (Appendix 3).
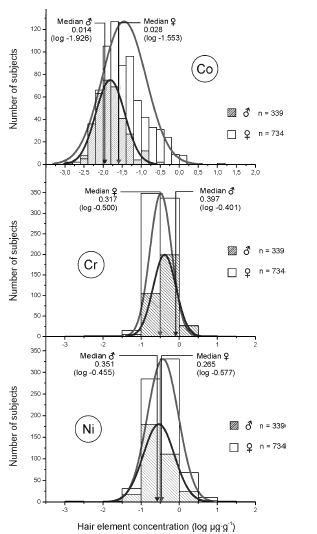
Top: Hair cobalt frequency distribution in men (gray) and women (white) (log μg∙g-1). Center: Hair chromium frequency distribution in men (gray) and women (white) (log μg∙g-1). Bottom: Hair nickel frequency distribution in men (gray) and women (white) (log μg∙g-1).
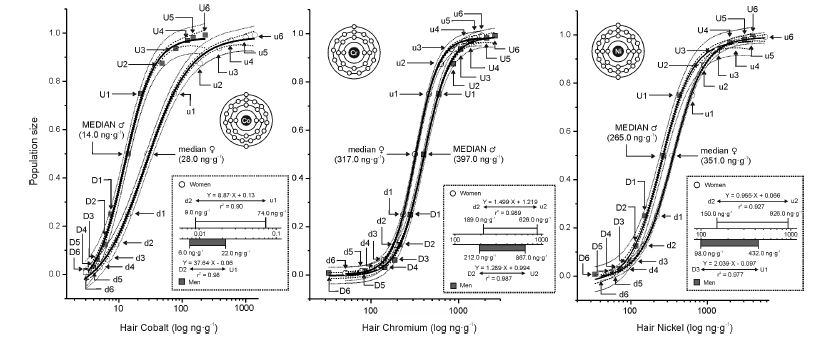 Figure 3: Median derivatives bioassay for hair Co, Cr, and Ni in men and women.
Left: Hair cobalt power law bioassay sigmoid function curve of hair cobalt median derivatives. The difference between the H∙Co median derivatives of men n=339 (gray) and women n=734 (white). D, U men downward (D) and upward (U) median derivatives; d, u women downward (d) and upward (u) median derivatives. –– Logistic function Y = A2 + (A1-A2)/(1 + (X/X0)p), - - - 0.95 confidence limit, ••• 0.95 prediction limit. Men: Y = 0.98 + (-0.062 – 0.98)/(1 + (X/0.012)1.912), r2 = 0.997; Women: Y = 0.985 + (-0.08 – 0.985)/(1 + (X/0.026)1.240), r2 = 0.998. Box: Hair cobalt linear saturation range for ♂ and ♀ (log concentration).
Center: Hair chromium power law bioassay sigmoid function curve of hair chromium median derivatives. The difference between the H∙Cr median derivatives of men n=339 (gray) and women n=734 (white).
D, U men downward (D) and upward (U) median derivatives; d, u women downward (d) and upward (u) median derivatives.
–– Logistic function Y = A2 + (A1-A2)/(1 + (X/X0)p), - - - 0.95 confidence limit, ••• 0.95 prediction limit.
Men: Y = 0.983 + (0.002 – 0.983)/(1 + (X/0.321)3.352), r2 = 0.999;
Women: Y = 0.987 + (-0.003 – 0.987)/(1 + (X/0.402)3.005), r2 = 0.999.
Box: Hair chromium linear saturation range for ♂ and ♀ (log concentration).
Right: Hair nickel power law bioassay sigmoid function curve of hair nickel median derivatives. The difference between the H∙Ni median derivatives of men n=339 (gray) and women n=734 (white).
D, U men downward (D) and upward (U) median derivatives; d, u women downward (d) and upward (u) median derivatives.
–– Logistic function Y = A2 + (A1-A2)/(1 + (X/X0)p), - - - 0.95 confidence limit, ••• 0.95 prediction limit.
Men: Y = 0.975 + (-0.026 – 0.975)/(1 + (X/0.252)2.151), r2 = 0.997;
Women: Y = 0.99 + (-0.01 – 0.99)/(1 + (X/0.354)2.114), r2 = 0.999.
Box: Hair nickel linear saturation range for ♂ and ♀ (log concentration). See Appendix 3 for the input data to the median derivatives bioassay (Co, Cr, Ni) and Appendix 4 for the median derivatives bioassay [78, 79].
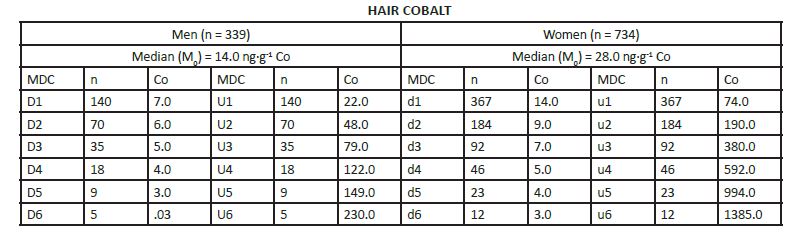
The log-transformed hair and whole blood data (Appendix 3), were used to fit the sigmoid power Law bioassay saturation curve (Appendix 4). Every one of the three sigmoid curves for the hair Co, Cr, and Ni, has its own linear segment range (du) for women (W), and D-U range for men (M), respectively (pg∙g-1): Co ♂ 6.0 - 22.0 (r2 = 0.98), ♀ 9.0 – 74.0 (r2 = 0.90); Ni ♂ 98.0 - 432 (r2 = 0.98), ♀ 150 - 926 (r2 =0.93); and Cr ♂ 212 – 867 (r2 = (0.99), ♀ 189 - 626 (r2 = 0.99)(Figure.3). High Confidence Interval (CI) values and correlation coefficients (r2 > 0.90) are observed for the linear segments of the sigmoid curve for all three enumerated bioelements. Within that linear interval range, women have more Co and Ni in their hair, whereas men have more chromium.
The log-transformed data from whole blood (Appendix 3), were used to fit the sigmoid power Law bioassay saturation curve (Appendix 4). Every one of the three sigmoid curves for the whole blood Co, Cr, and Ni, has its linear segment range d-u for women (W) and D-U for men (M ), respectively (pg∙g-1); Co ♂ 0.30 - 0.80 (r2 = 0.94), ♀ 0.22 – 0.85 (r2 = 0.98); Ni ♂ 2.2 - 8.2 (r2 = 0.93), ♀ 2.1 – 7.8 (r2 = 0.99); and Cr) ♂64 - 97.4 (r2 = 0.99) ♀ 65.3 - 100 (r2 = 0.98)(Figure.4). Evidently, the saturation capacity of human whole blood, indicates a very narrow therapeutic range for Co, Cr, and Ni, and what should be carefully watched during the TPN. In no case should the upper whole blood range levels of 0.85, 100, and 8.2 pg∙g-1 for Co, Cr, and Ni, be exceeded.
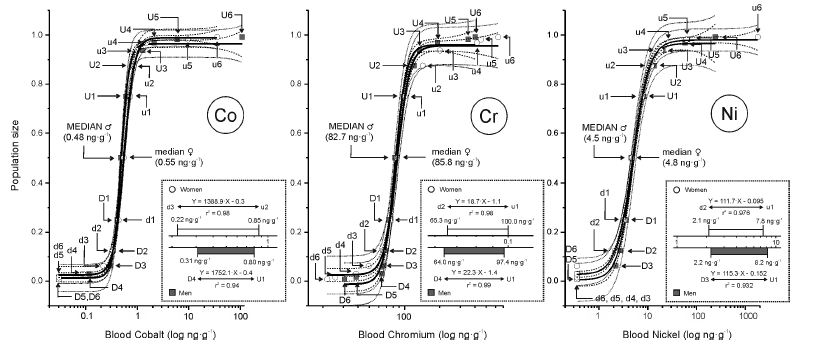 Figure 4: Median derivatives bioassay for whole blood Co, Cr, and Ni in men and women.
Left: Whole blood cobalt power law bioassay sigmoid function curve of whole blood cobalt median derivatives. The difference between the WB∙Co median derivatives of men n=91 (gray) and women n=142 (white). D, U men downward (D) and upward (U) median derivatives; d, u women downward (d) and upward (u) median derivatives. –– Logistic function Y = A2 + (A1-A2)/(1 + (X/X0)p), - - - 0.95 confidence limit, ••• 0.95 prediction limit. Men: Y = 0.964 + (0.013 – 0.964)/(1 + (X/0.001)5.681), r2 = 0.997; Women: Y = 0.989 + (0.025 – 0.989)/(1 + (X/0.001)4.379), r2 = 0.999. Box: Whole blood cobalt linear saturation range for ♂ and ♀ (log concentration). Center: Whole blood chromium power law bioassay sigmoid function curve of whole blood chromium median derivatives. The difference between the WB∙Cr median derivatives of men n=91 (gray) and women n=142 (white). D, U men downward (D) and upward (U) median derivatives; d, u women downward (d) and upward (u) median derivatives. –– Logistic function Y = A2 + (A1-A2)/(1 + (X/X0)p), - - - 0.95 confidence limit, ••• 0.95 prediction limit. Men: Y = 0.96 + (-0.012 – 0.96)/(1 + (X/0.083)8.985), r2 = 0.993; Women: Y = 0.956 + (0.025 – 0.956)/(1 + (X/0.086)8.083), r2 = 0.994. Box: Whole blood chromium linear saturation range for ♂ and ♀ (log concentration). Right: Whole blood nickel power law bioassay sigmoid function curve of whole blood nickel median derivatives. The difference between the WB∙Ni median derivatives of men n=91 (gray) and women n=142 (white). D, U men downward (D) and upward (U) median derivatives; d, u women downward (d) and upward (u) median derivatives. –– Logistic function Y = A2 + (A1-A2)/(1 + (X/X0)p), - - - 0.95 confidence limit, ••• 0.95 prediction limit. Men: Y = 0.965 + (0.005 – 0.965)/(1 + (X/0.004)2.827), r2 = 0.992; Women: Y = 0.98 + (0.027 – 0.98)/(1 + (X/0.404)2.556), r2 = 0.998. Box: Hair nickel linear saturation range for ♂ and ♀ (log concentration). See Appendix 3 for the input data to the median derivatives bioassay (Co, Cr, Ni) and Appendix 4 for the median derivatives bioassay [78, 79].
We also compared the Co, Cr, and Ni in the hair (a long-term biological indicator) with that of their concentration in the whole blood (a short-term biological indicator) (Figure.5). Our results showed that these two biological indicator tissues are not commensurable. Indeed, the time base for the elimination of the bioelement from the body via the whole blood is measured in days, whereas that for hair covers months. Thus, we have calculated that it would take a month of a cumulative urine collection to be comparable with the one cm of hair length. We have compared two central tendencies, i.e., the arithmetic mean (Mean) and the median of the linear segment of the bioassay sigmoid curve (Table 2). The arithmetic means for hair Co, Cr, and Ni concentration was considerably higher than that of the corresponding medians. These data differences reflect the consequence of the non-Gaussian distribution of the non- log-transformed Co, Cr, and Ni concentrations. If we look at the safe region of the sub-zoned adequate sigmoid saturation bioassay curve, i.e., 60 - 90% saturation range, then we will see how the arithmetic means of the hair Ni and Cr appears above the top of the safe sub-zone of the median derivatives. Evidently, the currently available literature references on the arithmetic means of Co, Cr, and Ni concentrations in the hair shows systemic error towards the higher values. The hair Co concentrations were higher in women, regardless of the difference in calculating the central tendency with either arithmetic mean or median. However, all three bioelement medians differ between men and women. Thus, both Co and Ni were higher in women than in men, but chromium was higher in men than women. We assume this difference to be significant since the gender dependent confidence interval (CI) lines of the Co, Cr, and Ni sigmoid curves, for women and men, did not overlap.
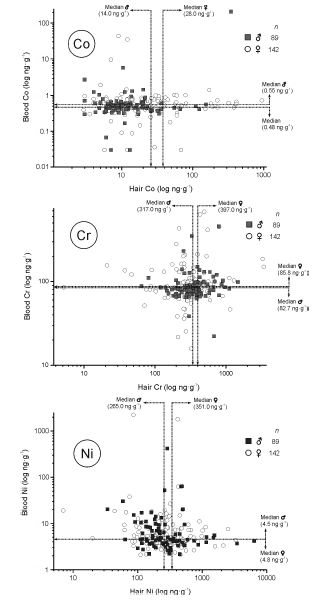
Figure 5: There is no correlation between the concentration of Co (Top), Cr (Center), and Ni (Bottom) in the hair and whole blood. o Women, ● Men.
Table 2: Comparative hair analysis of Co, Ni, and Cr with a standard analysis (Mean, SD) and bioassay approach with log transformed data (ng g-1) (Men, n = 339; Women, n = 734).
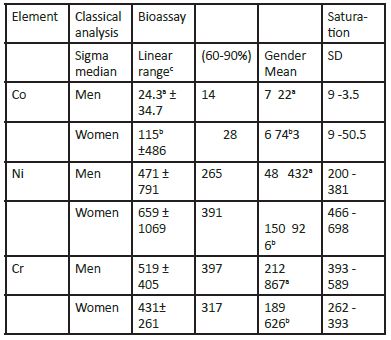
Means and linear ranges bearing different superscripts in the same column differ significantly, SD standard deviation, Coefficients of variation does not overlap. Thus far we did not observe that the aging process would be followed by either an increase or decrease in the concentration of the bioelements Co, Cr, and Ni in the hair (Figure. 6). Again, there was no commensurability between Co, Cr, and Ni in the hair over the tested age interval of 18 – 90+ years. In Croatia, legal adulthood is reached at the age of 18 yr.
.JPG) Figure 6: Aging did not affect the content of Co (Top), Cr (Center), and Ni (Bottom) in the hair in men and women. o Women, ● men.
Figure 6: Aging did not affect the content of Co (Top), Cr (Center), and Ni (Bottom) in the hair in men and women. o Women, ● men.
At the end of the Results section, we have presented our expanded Tentative Hair Multi Bioelement Nutritional Status Assessment Guidelines for Medical Practice (Table 3). There we have defined the adequate ranges for the thus far tested hair bioelements with a median derivatives bioassay (μg∙g-1) [2]. This summary table is based on the hair bioelement analytical results obtained at the Center for Biotic Medicine, Moscow, Russia. We consider such data necessary for the practicing health care providers in order to get a direct insight into the usefulness of the hair multi-bioelement analysis in assessing the nutritional health status of their patients.
Table 3: Summary of adequate human scalp hair multibioelement range as assessed with the median derivatives bioassay.
.JPG)
DISCUSSION
Assessing the human bioelement nutritional status of Co, Cr, and Ni is an important nutritional issue. In this article, we have presented the evidence on how to assess Co, Cr, and Ni nutritional status by analyzing their hair frequency distribution with the median derivatives bioassay. Such an approach allowed for data presentation as a sigmoid curve where the deficiency, adequacy, and excess of the bioelements are easily zoned. Indeed, the subtle zoning of the adequate linear range allows for grading of the pattern of the hair bioelement saturation. In other words, the biological response to a bioelement nutritional intake should be presented in the range format [56].
Our data on hair Co, Cr, and Ni, when presented on the standard linear scale (Table 2) are comparable with those reported in the literature [57-60]. However, our bioassay data are quite novel and therefore would need to be validated by the other researchers. On the average, our study’s hair Co, Cr, and Ni arithmetic mean concentration data were substantially higher than the comparable hair bioelement median data. With the advancement of computer software, the fitting of the sigmoid curves became widely accessible, and what otherwise might take ages, if done with paper and pencil.
Our confidence intervals for the linear segments of Co, Cr, and Ni in the hair showed significant correlation coefficients (r2 ≥ 0.90). Such a high level of precision allowed for detection of subtle gender dependent differences between Co, Cr, and Ni in men and women. Indeed, hair Co and Ni were higher in women’s hair, whereas hair Cr was higher in men’s hair. We have observed similar sex dimorphism in hair Ca, Mg, and Sr where women have much higher concentrations of the enumerated osteotrophic bioelements than men [2]. That cobalt is higher in women than men has been already reported [61- 63], but no explanation was ever offered for that fact in the available literature.
The major conceptual novelty of the median derivatives bioassay is that, with the bioassay, we are dealing with the data having Gaussian frequency distribution and not with the skewed and kurtosis distributed data. Essentially, we have generated a continuous (analog) data set from the individual digital data [64]. However, we have had a large number of available data to assemble a sigmoid curve having narrow confidence intervals. The obvious advantage of the proposed bioelement median derivatives bioassay is the number of points for drawing the line; we have more than three median derivatives intervals available to draw the straight line through them. Gold [49] would comment on this fact in his analysis about the pitfalls ofm the regression analysis applied beyond the limits of the actually measured data: “Give me five points and I can draw you an elephant, and if you gave me six, I can make his tail wiggle”. The capacity of the power Law and sigmoid curves was already used in assessing the protein requirements [65-67]. In an attempt to describe the entire growth curve, Schulz [65] and Mercier [66, 67] have developed a complex polynomial curve for assessing the nutrient-response relationships, and what curves require a considerable degree of mathematical literacy from a reader to be able to follow the argument. Recently, Zheng et al. [68] took a similar analytical approach as we did with the median derivative bioassay. They also did log data conversion and then used a spline with confidence interval to get a straight line through the 25, 50, and 75 percentile points. Indeed, we have used median derivatives to draw a sigmoid curve where the linear range may pass through the 12.5, 25, 50, 75, and 87.5 percentage points of the median derivatives. Some readers may object that the end numbers of our linear range analysis are not nicely rounded, digits. Since we are dealing with probabilities, there is always a possibility that end-point data would vary to some degree, by the bending of the sigmoid curve, either preceding or following the linear range segment, which would give us enough flexibility to make acceptable approximations. A Similar objection may be raised that the median and range data obtained for Croatian people may hold differently somewhere such as Texas [69]. Indeed we have seen that data for hair phosphorus in the adults from Croatia and Texas did not differ regardless of the different analytical methods and instruments, or the spacing of time between the compared analyses, and geographic location of the tested population [2]. Indeed, the data on hair calcium between the tested populations in Croatia and those quoted by DiPietro et al [69] in Texas, did differ considerably, indicating that dietary calcium intake may be quite different in Croatia and Texas (it was higher in Croatia). However, data also indicate that slight modifications in sample preparation may favor analysis of one element over the other [2]. Moreover, if an element concentration is more prevalent in one population than in the other, then the data would concentrate on the different parts of the linear range of the sigmoid saturation curve. We are not claiming that our Croatian medians would be a worldwide standard, but we propose that the data from different regions in the world may group differently along the linear part of the common sigmoid curve. Something that, thus far, was not available for the scientists to compare the results from different parts of the world. Numerous comparative studies have shown that whereas the analytical hair bioelement results within the same laboratory are fairly consistent [70], the comparison between the labs are disappointing [71]. Even though the destruction of the biological matrices has evolved tremendously, blanks were fine, ultra pure chemicals available, back-ground corrections flawless, certified standards at disposal, risk of external contamination reduced to the minimum, replicates were as they should be, quality control was never higher, and the final analytical results between the laboratories would vary widely. We consider that the linear structuring of the data preceding statistical data analysis was at the core of the reported skew and kurtosis ascribed to the analytical error (uncertainty [72]. However, the problem of the difference in analytical results between the laboratories may be resolved if the two different laboratories analyze the same true hair sample and not the human prepared bioelement certified hair standard. That would allow for a simple calculation of a conversion coefficient ratio for comparing the difference between the results of two laboratories.
Apparently, there was no effect of age on hair Co, Cr, and Ni bioelement concentration in this study [73] reported that hair Cr content is decreasing with age of the studied subjects. However, we did not found any other study to support their findings in the available literature. Indeed, the rate of hair growth and its composition does not appear to change with age, but the number of the hair follicles does decrease with age [12]. Since we express our bioelement concentration per unit weight of the hair, it is not likely that the hair bioelement concentrations of Co, Cr, and Ni would change with advanced age.
Also, we did not find that the whole blood Co, Cr, and Ni would correlate with those for hair Co, Cr, and Ni concentrations (Figure.5). However, we have found that the saturation of the whole blood with Co, Cr, and Ni is occurring rapidly, and that indicates their very narrow therapeutic window. Something what, thus far, we have observed only in the case of a whole blood lithium [74]. The data indicate how great caution should be exerted if giving Co, Cr, and/or Ni, either separately or in combination, to the total (intravenous) parentera- nutrition solution. In our opinion, whole blood concentrations of Co, Cr, and Ni in any moment should never exceed (ng∙g-1): 0.85 Co, 100 Cr, and 8.2 Ni.
In this study, we have demonstrated how frequency distribution of hair Co, Cr, and Ni, may be used for the assessment of their nutritional status with a median derivatives bioassay. We think that dietary requirement should be based on what has been actually absorbed into the hair rather than on what is the amount of a bioelement in the diet. Indeed, measuring dietary intake to assess the dietary reference intakes is often based on the elusive dietary interviews [75-77]. Today, the health practitioners need a reliable guide on how to assess the individual multi bioelement nutritional status. We hope that this article may help in this endeavor.
APPENDIX 1: Instrumental setting fo Co, Cr, and Ni analysis. The ICP-MS system was conditioned and calibrated via external calibration. The external calibration solutions containing 0.5, 5, 10 and 50 ppb were freshly prepared for every sample batch from the Universal Data Acquisition Standards Kit (#N9306225, PerkinElmer Inc.) diluted in DDIW acidified with 1% of HNO3. In order to account for incomplete acidity and viscosity matching between calibration and sample matrices the online internal standardization with yttrium-89 and rhodium- 103 was used via 7-port FAST valve. The internal standard solution containing 10 ppb Y and Rh was prepared from the stock yttrium and rhodium solutions (#N9300167 and #N9300144, PerkinElmer Inc.) in 8% of 1-Butanol ((#1.00988, Merck KGaA), 0.8% Triton X-100 (Sigma #T9284 Sigma-Aldrich, Co.), 0.02 % TMAH (#20932, Alfa-Aesar, Ward Hill, MA 01835 USA), and 0.02% EDTA acid (Sigma #431788 Sigma-Aldrich, Co.).
Certified reference material GBW09101 – Human Hair (Shanghai Institute of Nuclear Research, Academia Sinica, China) was used for the quality control of the analytical data.
.JPG)
APPENDIX 2: Preparation of hair and blood prior to the Co, Cr, and Ni analysis. Hair analysis Strand of hair 5-7 cm long and weighting less than one gram would be cut with titanium-coated scissors over the anatomicallywell-defined bone prominence at the back of the skull (lat. protuberantia occipitalis externa). The individual hair samples were further minced into strands less than 1 cm long prior to chemical analysis, stirred 10 min in an ethylether/acetone (3:1, w/w), rinsed three times with deionized H2O (18 MΩ∙cm), dried at 85°C for one hour to constant weight, immersed one hour in 5% EDTA, rinsed again in the deionized H2O, dried at 85°C for twelve hours, wet digested in HNO3/ H2O2 in a plastic tube, sonicated, and microwaved. The digested solutions were quantitatively transferred into 15 ml polypropylene test tubes. The liners and top were rinsed three times with the deionized water, and the rinses were transferred into the individual test tubes. These test tubes were filled up to 15 ml with deionized water and thoroughly shaken to mix. The samples were run in NexION 300 +NWR 2013 spectrometer (Perkin Elmer, USA). Graduation of the instrument was carried out with a monelement Perkin Elmer reference solution. We used certified GBW09101 Human Hair Reference Material (Shanghai Institute for Nuclear Research, Academia Sinica, Shanghai 201849, China to validate the quality of the analytical work. Whole Blood Analysis Whole blood was drawn by venipuncture from v. cubiti and collected into green-cup Vacuette collecting tubes (#454082 LotA13030M7m Greineer Bio On International AG Kremsmunster, Austria) which were randomly assigned for the ICP-MS analysis. Whole blood samples of 0.5 ml were digested in a microwave oven with 0.1 ml of HNO3 at 175oC. Blood standards were liophylised Seronorm TM Trace Elements Whole Blood Reference Standards Level 1 (OK 0036, Level 2 (MR 9067), and Level 3 (Ok 0337) for Co, Cr, and Ni in the whole blood (SERO AS, Bilingstadt, Norway). Five ml of redistilled H2O were added to every reference standard and stirred gently at a room temperature for two hours to equilibrate. One ml of such equilibrated standard was pipetted in 25 ml quartz glass vial, dried at 105oC for 24 hours. The microwaved samples were dissolved in 5 ml of redistilled H2O with 0.1 ml of H2O2 added. All chemicals were of proanalytical grade (Khimmed Sintez, Moscow, Russia).
APPENDIX 3: Input data for the median derivatives bioassay Co, Cr, and Ni.
Cobalt median derivatives to fit the power function sigmoid. Hair Median Derivative Concentrations (MDC).
Whole blood Median Derivative Concentrations (MDC).
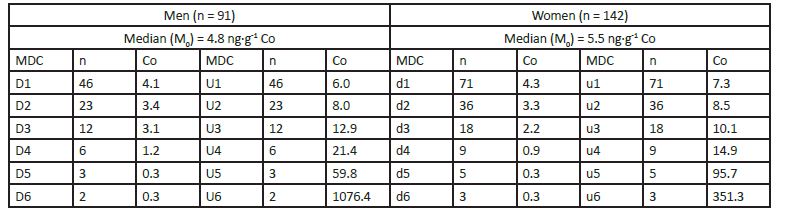 Capital letters (D1 – D6, U1 – U6) men, small letters (d1 – d6, u1 – u6) women.
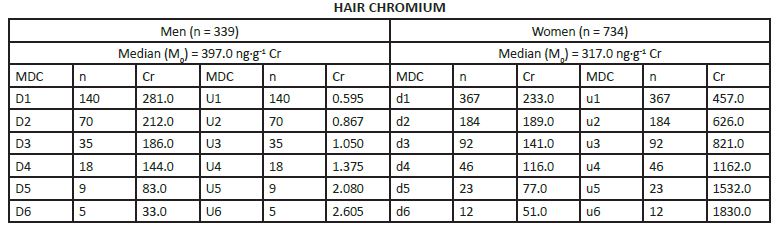
Chromium median derivatives to fit the power function sigmoid. Hair Median Derivative Concentrations (MDC).
 Whole blood Median Derivative Concentrations (MDC).
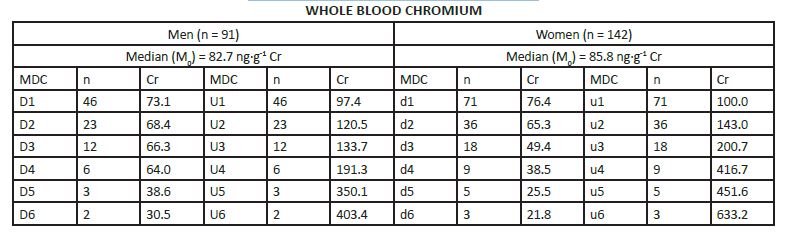 Capital letters (D1 – D6, U1 – U6) men, small letters (d1 – d6, u1 – u6) women.
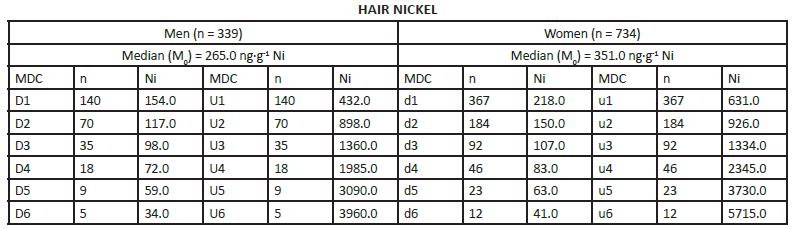
Nickel median derivatives to fit the power function sigmoid. Hair Median Derivative Concentrations (MDC).
 Whole blood Median Derivative Concentrations (MDC).
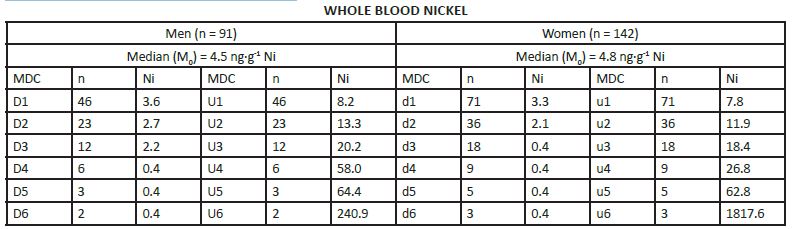 Capital letters (D1 – D6, U1 – U6) men, small letters (d1 – d6, u1 – u6) women.
APPENDIX 4: Median derivatives bioassay. (Population Size, PS = 1.000).
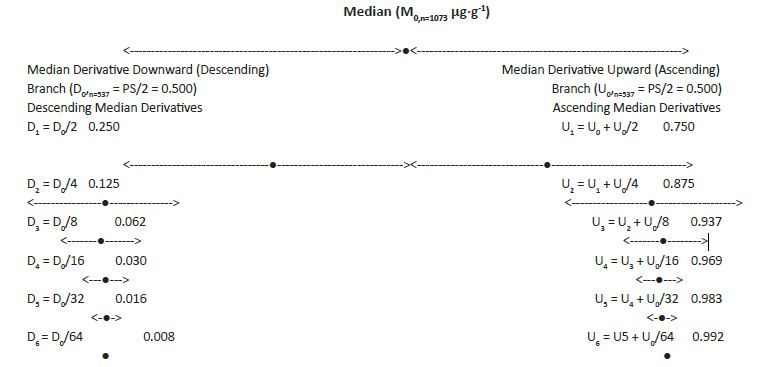
We studied the frequency distribution of hair and whole blood Co, Cr, and Ni median and its derivatives to assess the Co, Cr, and Ni nutritional status and environmental exposure. First we assess the median (M0) hair and whole blood concentrations of studied Co, Cr, and Ni. By definition, one half of the studied population was above the median (upward median branch, U0), and the other half was below the median (downward median branch, D0). Hence, the population size (PS) for M0 is the sum of the respective upward and downward median branches around the central inflection “hinge” M0, i.e., PS = U0 + D0 = 0.5 + 0.5 = 1.0. Both the respective upward and downward median branches can be further divided in the same “median of median” way into a series of sequential median derivatives (U0,1,2,3 …n-1, n and D0,1,2,3,…n-1, n). For every median derivative of the population, the actual hair and whole blood concentration can be identified. Thus, instead of mechanically throwing the preconceived percentile grid upon the observed data, we inferred the median derivative grid out from the data set itself [78, 79].
ACKNOWLEDGMENTS We wish to thank Prof. emeritus David F Marshall for his Englishlanguage review of the manuscript.
REFERENCES 1. Cousins RJ. (2006). Nutritional regulation of gene expression and nutritional genomics. In: Shills ME (Senior ed), Shike M, Ross AC, Caballero B, Cousins RJ (Associate eds) Modern nutrition in health and disease, 10th edn. Lippincott, Williams and Wilkins, Philadelphia, 615-626. 2. Momčilović B, Prejac J, Skalny AV and Mimica N. (2018). In search of decoding the syntax of the bioelements in human hair. A critical Overview. J Trace Element Biol Med. 3. Institute of Medicine. (1997). Dietary Reference Intakes for Calcium, Phosphorus, Magnesium, vitamin D, and Fluoride. The National Academy Press. Washington DC. 4. Institute of Medicine. (1998). Dietary Reference Intakes for Thiamin, Riboflavin, Niacin, Vitamin B6, Folate, Vitamin B-12, Pantothenic acid, Biotin, and Choline. The National Academy Press, Washington DC. 5. Institute of Medicine. (2001). Dietary Reference Intakes for vitamin A, vitamin K, Arsenic, Boron, Chromium, Copper, Iodine, Iron, Manganese, Molybdenum, Nickel, Silicon, Vanadium, and Zinc. The National Academy Press, Washington DC. 6. Institute of Medicine. (2004). Dietary Reference Intakes for a water, potassium, sodium, chloride, and sulfate. The National Academy Press, Washington DC. 7. Nielsen FH. (1984). Fluoride, vanadium, nickel, arsenic, and silicon in total parenteral nutrition. Bull N Y Acad Med. 60(2): 177-195. 8. Nielsen FH. (1990). New essential trace elements for the life sciences. Biol Trace Elem Res. 26-27: 599-611. 9. Prejac J, Skalny AA, Grabeklis AR, Uzun S, et al. (2017). Assessing the boron nutritional statusby analyzing its cumulative frequency distribution in the hair and whole blood. J Trace Elem Med Biol. 45(1): 50-56. 10. Gratzer W. (2009). Giant molecules from nylon to nanotubes. Oxford University Press, Oxford, UK.Element Med Biol. 45: 50-56. 11. Momčilović B, Prejac J, Brundić S, Morović S, et al. (2010). An assay on human and elements, multielement profiles, and depression. Translational neuroscience. 1(4): 322- 334. 12. Rook A, Dawber R. (1982) Diseases of the hair and scalp. Blackwell Scientific Publ., Oxford, UK. 13. Robbins CR. (2012). Chemical and physical behavior of human hair. 5th ed., Springer-Verlag, Berlin-Heidelberg, Germany. 14. Yoshinaga J, Shibata Y and Morita M. (1993). Trace elements determined along the single strands of hair by inductively coupled plasma mass spectrometry. Clin Chem 39(8): 1650-1665. 15. US Department of Health and Human Services. (2005). Toxicological profile for nickel. Public Health Services, Agency for Toxic Substances and Disease Registry (ATSDR), Atlanta, GA, USA. 16. Sunderman FW. (1977). A review of the metabolism and toxicology of nickel. Anal Clin Lab Sci, 7(5): 377-398. 17. Anderson RA. (1997). Chromium as an essential nutrient for humans. Regul Toxicol Pharmacol. 26(1 pt 2): S35-41. 18. Mertz W. (1993). Chromium in human nutrition: a review. J Nutr 123(4): 626-633. 19. Lison E. (2007). Cobalt. In: Handbook on toxicology of metals, 3rd ed., Chap 25, Academic Press, New York USA. 20. Czarnek K, Terpielowska S, Swicki A. (2015). Central Europ J Immunol, 40: 236-242. 21. Vincent JB. (2017). The evidence against chromium as an essential trace element. J Nutr. 147(12): 2212-2219. 22. Singer H, Berger MM, Van den Berghe G, Biolo G, et al. (2009). ESPEN guidelines on parenteral nutrition: Intensive care. Clin Nutr. 28(4): 387-400. 23. Stehle P, Stoffel-Wagner B and Kuhn KS. (2016). Parenteral trace element provision: recent clinical research and practical conclusions. Europ J Clin Nutr 70(8): 886-893. 24. Bernr YN, Shuler TL, Nielsen FH, Flombaum C, et al. (1989). Selected ultratrace elements in total parenteral nutrition solutions. Am J Clin Nutr. 50(5): 1079-1083. 25. Guyy RH, Hostynek JJ, Hinz R and Lorence CR. (1999). Metals and the skin. Topical effects and systemic absorption. Marcel Dekker, Inc., New York, USA. 26. Cronin E. (1980). Contact dermatitis. Churchill Livingstone, Edinburgh, Scotland. 27. Wahlberg JE. (1965). Percutaneous toxicity of metal compounds. A comparative investigation in guinea pigs. Arch Environ Health. 11(2): 201-204. 28. Basketter D, Horev L, Slodovnik D, Merimes S, et al. (2001). Investigation of the threshold for allergic reactivity to chromium. Contact Dermatitis. 44(2): 70-74. 29. Evans EM, Freeman MA, Miller AJ and Vernon-Roberts B. (1974). Metal sensitivity as a cause of bone necrosis and loosening of of the prosthesis in total joint replacement J Bone Joint Surgery Br. 56(4): 626-642. 30. Veien NK, Borchorst E, Mattel T and Laurberg G. (1994). Stomatitis or systematically-induced contact dermatitis from dental wire in orthodontic materials. Contact Dermatitis. 30(4): 210-213. 31. Torok L, Greczy I, Ocsai H and Czako J. (1995). Investigation into the development of allergy to metal in recipients of implanted hip prostheses: A prospective study. Eur J Dermato. l5: 294-295. 32. Celebic A, Baucic M, Stipetic J, Baucic I, et al. (2006). Ion release from gold/platinum dental alloy: Could release of other elements be accountable in the contact allergy attributed to the gold? J Mater Sci Mater Med. 17(4): 301- 305. 33. Heath JC. (1954). Cobalt as a cancerogen. Nature. 173: 822-823. 34. Flessel CP, Furst A and Radding SB. (1980). A comparison of cancerogenic metals. In: Sigel H (ed) Carcinogenicity and metal ions. Marcel Dekker, New York. 35. Sky-Peck HH. (1986). Trace metals and neoplasia. Clin Phsiolo Biochem. 4(1): 99-111. 36. Waalkes MP. (2002). Metal carcinogenesis. In: Sarkar B (ed) Heavy metasls in the environment Marcel Dekker Inc., New York, NY. 121-146. 37. Skeikh I. (2016). Cobalt poisoning. A comprehensive review of the literature, Med toxicol clini forensic med. 2: 2-8. 38. Momčilović B. (1988). The epistemology of trace element balance and interaction. Plenary Lecture. In: Hurley LS, Keen CL, Lonnerdal B, Rucker RB (eds) Trace Elements in Man and Animals (TEMA 6). Pergamon Press, New York and London. 6: 173-177. 39. Philibert J. (2005). One and a half century of diffusion: Fick, Einstein, before and beyond. Diffusion fundamentals. 2: 1.1-1.10. 40. Anderson RA and Kozlovsky AS. (1985). Chromium intake, absorption, and excretion of subjects consuming self-selected diets. Am J Clin Nutr. 41(6): 1177-1183. 41. Expert Group on Vitamins and Minerals. (2003). Safe upper levels for vitamins and minerals. Food Standard Agency. 42. Dabeka RW and McKenzie AD. (1995). Survey of lead, cadmium, fluoride, nickel, and cobalt in food composites and estimation of dietary intakes of these elements in Canadians in 1986- 1988. J AOAC Int 78(4): 897-909. 43. Brown M. (2005). Charter of rights is adopted in the UN, The New York Times. 44. Oppenheim N. (1992). Questionnaire – design, interviewing, and attitude measurement. Continuum, London, UK. 45. International Atomic Energy Agency (IAEA). (1980). Elemental Analysis of biological materials, IAEA – TEC. DOC 197. International Atomic Energy Agency, Vienna, Austria. 46. Burges C. (2000). Valid analytical methods and procedures. The Royal Society of Chemistry. Cambridge, UK. 47. Momčilović B, Prejac J, Momčilović R, Ivičić N, et al. (2008). On the same element isotope mass number (Pleiad) and the clusters of elements bearing the same mass numbers in the Periodic system – the “chesshyja” (fish skin) model. Trace Element Med (Moscow). 9(3-4): 5-20. 48. Heyes B. (2017). Fool proof and other mathematical meditations. The MIT Press, Cambridge, MA, USA. 49. Gold HJ. (1977). Mathematical modeling of biological systems. Wiley, New York. 50. Harpley FW, Stewart GA and Young PA. (1973). Principles of biological assay. In: Delanouis AL (ed) International Encyclopedia of Pharmacology and Therapeutics, vol.1. Pergamon Press, Oxford. 51. Grahame-Smith DG and Aronson JK. (1985). Oxford textbook of clinical pharmacology and drug therapy, Oxford University Press, Oxford, UK. 52. Rampell DM, Rosemberg J and Harrison JR. (1990). Biological monitoring in occupational medicine. In: LaDou J (ed) A Lange Medical Book, Appleton and Lange, Norwalk, CT. 53. Brody TM. (1994). Concentration-response relationship, Ch.3, 2 nd ed. In: Brody TM, Larner J, Minneman KP, Neu HC (eds) Human pharmacology. Molecular to chemical. Mosby, St Louis. 54. Gad C. (2001). Statistics for toxicologist, 4th ed. In: Hayes AW (ed) Principles and methods in toxicology. Taylor and Francis, Philadelphia PA. 55. Schutte KH. (1964). The biology of trace elements. Crosby Lockwood and Son. Ltd. Lodon, UK. 56. Momčilović B, Reeves PG and Blake MJ. (1997). Idiorrhythmic zinc dose-rate variability in dietary zinc intake generates a different response pattern of zinc metabolism than conventional dose-response feeding. Br J Nutr 78(1): 173-191. 57. Caroli S, Alimonti A, Coni E, Petrucci F, et al. (1994). The Assessment of Reference Values for Elements in Human Biological Tissues and Fluids: A Systematic Review, Critical Rev. Analyt. Chem. 24(5-6): 363-398. 58. Goulle JP, Mahieu L, Castermant J, Neveu N, et al. (2005). Metal and metalloid multi-elementary ICP-MS validation in whole blood, plasma, urine and hair. Reference values. Forensic Sci Int. 153(1): 39-44. 59. Chojnacka K, Zielinska A, Gorecka H, Dobrzanski Z, et al. (2010). Reference values for hair minerals of Polish students, Environ Toxicol Pharmacol. 29(3): 314-319. 60. Kemptdon M and Lombi E. (2011). Hair analysis as a biomonitor for toxicology, disease and health status, Chem Soc Rev 40(7): 3915-3940. 61. Low-Beer TS, McCarthy FC, Austad WI, Brzechwa-Ajdukiewicz A, et al. (1968). Serum vitamin B12 levels and vitamin B12 Binding capacity in pregnant and non-pregnant Europeaans and West Indians. Br Med J 4: 160-161. 62. Metz J, Hart D and Harpending HC. (1971). Iron, folate and vitamin B12 nutrition in a hunter-gatherer people; A study of the Kung Bushmen. Am J Clin Nutr 24(2): 229- 242. 63. Fernandes-Costa F, van Tonder S and Metz J. (1985). A sex difference in serum cobalamin and transcobalamin levels. Am J Clin Nutr. 41(4): 784-786. 64. Knill O. (2009). Probability theory and stochastic processes with application. Oveseas Press, New Delhi, India. 65. Schulz AR (1987) Analysis of nutrient-response relationships. J Nutr. 117(11): 1950-1958. 66. Mercer LP. (1988). Nutrient response relationships and saturation kinetics. J Nutr. 98: 918-926 67. Mercer LP, May HE and Dodds SJ. (1989). The determination of nutritional requirements in rats: Mathematical modeling of sigmoidal inhibited nutrient-response curves. J Nutr 119(10): 1465-1471. 68. Zheng Z, Harman JL, Coresh J, Kottgen A, et al. (2018). The dietary fructose: vitamin C intake ratio is associated with hyperuricemia in African-American adults. J. Nutr. 148(3): 419-426. 69. DiPietro ES, Phillips DL, Paschal DC and Neese JW. (1989). Determination of trace elements in human hair. Refedrence intervals for 24 elements in nonoccupationaly exposed Adults in the US and effects of hair treatments. Biol Trace Element Res. 22(1): 83-100. 70. Momčilović B, Prejac J, Ivičić N (2009) A case report on analytical reproducibility of the hair multielement profile: A two years follow up. Trace Element Med (Moscow), 10(1-3);33-38.hair treatments. Biol Trace Element Res 22: 83-98. 71. Druyan ME, Bass D, Puchyr R, Urek K, et al. (1998). Determination of reference ranges for elements in human scalp hair. Biological Trace Element Research. 62(3):183- 197. 72. Momčilović B. (2014). On variability and dispersion of trace element analytical data results in the biological indicator tissue of hair. The power Law disguised in the analytical error. Trace Elements in Man and Animals (TEMA 15), Book of Abstracts, University of Florida, Orlando, FL. USA. p.80. 73. Davies S, McLaren Howard J, Hunnisett A and Howard M. (1997). Age related decreases in chromium levels in 51,5665 hair sweat, and serum samples from 40,872 patients – Implications for the prevention of cardiovascular disease and type II diabetes mellitus. Metabolism. 46(5): 469-473. 74. Mimica N, Prejac J and Momčilović B. (2017). Assessing the human lithium environmental exposure by frequency distribution analysis of lithium in the hair and blood. J Trace Element Med Biol. 41(S1): 46. 75. Cade J E, Burley VJ, Warm DL, Thompson RL, et al. (2004). Food-frequency questionnaires: a review of their design, validation and utilization. Nutr Res Rev. 17(1): 5-22. 76. Yuan Z, Spiegelman D, Rimm EB, Rosner BA, et al. (2017). Relative validity of nutrient intakes assessed by questionnaire, 24 hour recalls, and diet records compared with urinary recovery and plasma concentration bioamarkers: findings for women. Am J Epidemiol. Doi. 77. Dhurandhar NV, Schoeller D, Brown AW, Heymsfield SB, et al. (2015). Energy balance measurement: when something is better than nothing. Int J Obes (London). 39(7): 109-1113. 78. Momčilović B, Prejac J, Vinjević V, Mimica N, et al. (2012). Hair silver median derivatives for the assessment of the environmental silver exposure, overexposure, and toxicity. Trace Element Med (Moscow). 13 (3): 27-36. 79. Smylevich L and Dougherty ER. (2012). Probabilistic Boolean network, Society for industrial and applied mathematics Philadelphia, PA, USA.