Information Links
Related Conferences
Previous Issues Volume 6, Issue 2 - 2023
Emergence, Submergency, And Revival of Hair Multi Bioelement Analysis in Public Health
Berislav Momčilović*
Institute for Research and Development of the Sustainable Eco System, Croatia
*Corresponding author: Berislav Momčilović, Prof, MD, MSc, PhD, Institute for Research and Development of the Sustainable Ecosystems (IRES), Srebrnjak 59, 10000 Zagreb, Croatia; E-mail: [email protected].
Received Date: July 10, 2023
Published Date: July 31, 2023
Citation: Momčilović B. (2023). Emergence, Submergency, And Revival of Hair Multi Bioelement Analysis in Public Health. Mathews J Nutr Diet. 6(2):25.
Copyrights: Momčilović B. © (2023).
ABSTRACT
The bio elements, i.e. electrolytes, trace elements, and ultra-trace elements, nutritional status is an important indicator of human health. Herewith, we analyzed the hair bio element contents of (in decreasing order of abundance): Ca, Zn. P, Na, K, Mg, Si, Cu, Fe, Al, B, Sr, Cr, I, Se, Ni, Mn, Mo, Ag, Li, Co, and Au, with the ICP MS. We assessed the hair bio element nutritional status with the Median derivatives Bioassay. The most recent study revealed that the major objection for the wider use of hair bio element analysis was the discrepancy in the analysis of the hair replicates, because it was wrongly assumed that the full hair sample is a homogenous set of hair piles in the same stage of their growth and development. Our approach provides for f the reliable reference ranges in assessing the bio element nutritional status. Now it is possible to assess the bio element nutrition al status and bio element interactions in the vulnerable segments of the human population without violating the ethical health considerations in regard to the studied subjects.
Keywords: Bio Elements, Human Health, Nutrition, Chemical Analysis, Hair Samples.
EDITORIAL
Hair is an easily and painlessly accessible human biological indicator tissue for the bio element analysis since it is easy to collect, store and transport to some well-equipped chemical laboratory [1]. Indeed , it has been known for a long time that bio elements, the term that we use here as a common summary name for all the electrolytes (major elements, trace elements, and ultra-trace elements, that, may be found in the hair [2].The development t of modern analytical techniques like Atomic Absorption Spectrometry (AAS) in the 60’ and Inductively Coupled Plasma Mass Spectroscopy (ICP MS) in 70’ of the last century gave us the accurate instruments to precisely and accurately analyses microgram quantities of the bio elements in the given biological samples. However, AAS may be used to analyze different bio elements in a one by one sequence, whereas the ICP MS may analyze a multiple bio elements content of the tested sample simultaneously. This new analytical techniques arose hopes for new diagnostic possibilities in the diagnostics of the bio element nutritional status and especially, the bio element deficiency and excess. However, the replicate studies of the bio elements in the hair showed excessive difference between the bio element content of the hair replicates. The emerged enthusiasm for the wider use of hair bio element concentrations analysis for the Public Health got submerged.
A plethora of explanations was tried and they all boil down to the differences in chemical analysis of the hair samples and their possible external contamination. We have the same question in our mind on how reliable are our hair bio element concentration in healthy and people suffering from depression [3]. Recently, however, Diah and Wong [4] have proved that the hair chemical analysis was not to be blamed for the diversity of the bio elements contents in the, what we call the hair replicates. Indeed, every hair sample is a mixed set of hair piles (and their follicles) at the different stage of their development. The chemical analysis was accurate, but the premise of hair subsample identity, i.e., the replicate, was wrong. In plain English, what we have considered to be the identical replicate, it was it not [5].
As a young Postdoctoral Fellow of the National Research Council of Canada, I studied the problem of zinc availability from milk protein and plant protein based infant formulas [4]. During that study I observed that the amount of zinc in the bones was linearly growing with the amount of zinc in the diet from zero to 12 ppm, and that after that the more addition of zinc to the diet was leveled off. This pattern reappeared after the decades in our idiorrhythmic experiments [6]. At the same time I came across the Prof. Gayton’s seminal study on a biological system analysis of blood circulatory volume control. The reference from Physiology Reviews is still somewhere in my reference storage. I still remember the large A3 paper format map, similar to the maps provided with the TV set purchase in Europe at that time. I was impressed with a clear graphic on how the response to whatever stimulus was followed by a sigmoid saturation functions. It should be noted that it was before the PC’ and statistical packages became available. The presented mathematical model analysis was supported by the US Army and other similar agencies, what precludes my research on that subject. As a matter of fact, coming from then Yugoslavia (a non-aligned country), I was considered to be coming from the East side of the “iron curtain” in the West, but also belonging to the West from the east side of the same curtain. That was the political map of the World in then in1975.
Since I assumed my research activities, I have collected a large and diverse collection of the scientific references. Therein, I found the work of Prod R Finney, a famous statistician who collaborated with RA Fisher, the father of statistical analysis of variance. It was his book on the probit analysis [7]. The study was devoted on how to estimate the upper limits of allowable toxicity of various chemical compounds. We expanded Finney’s concept to include the entire sigmoid saturation response curve from the low, to adequate, and further on excessive range of the stimulus impulse strength, i.e., the full hair bio element data collection. The result was our Median Derivatives Bioassay model [1], where the model was generated from the data, and not from some before preconceived model imposed upon the data. Apparently, we used Cantor’s set to define the linear segment around median of data as demonstrated in our article on assessing the population silver nutritional status in Croatia [8,9].
The summary of our research data on twenty two adequate bio element nutritional status assessment is presented in Table 1 [10]. Here we further graded the linear segment of the sigmoid saturation curve to cover for subclinical and high (but not excessive or toxic) bio element nutritional status. Evidently, the bio elements accumulion in the hair depends on how much are they present in our diet. Moreover, some bio elements are differently distributed in men and women like osteotrophic bio elements Ca, Mg and Sr which are preferentially deposited in the women hair [11]. Some form aggregates in supramolecular clusters like Na, K, P (or N) Mg, Ca [1 ]whereas, phosphorus stays practically invariant regardless of the geography of living place or race between white Caucasians in Europe, Japanese in Japan or Texas Mexicans workers. i.e., irrespective of 0o geography or race of human subjects [1].
Table 1. Reference range values for adequate bio element Nutritional status of men (M) and women (W) as assessed with the hair Median Derivatives Bioassay.
|
Element |
ADEQUATE (LINEAR PORTION of a SIGMOID CURVE) RANGE (µg∙g-1) |
||||||||
|
Minimum (Min) |
MEDIAN |
Maximum (Max) |
GOLDEN RANGE YARDSTICK |
||||||
|
(Lower Limit) |
(Upper Tolerance Limit) |
Conditionally optimal range (30 – 90% of Adequate range) |
|||||||
|
Men |
Women |
M |
W |
Men |
Women |
Men |
Women |
||
|
Calcium |
Ca |
291 |
487.7 |
492 |
1721.4 |
816.4 |
4 426. |
599-761 |
971-4195 |
|
Zinc |
Zn |
126 |
131 |
179 |
183 |
247 |
234 |
103-198 |
181-224 |
|
Phosphorus |
P |
121.9 |
124.5 |
150.8 |
154 |
184.1 |
199.2 |
131-188 |
147-177 |
|
Sodium |
Na |
84 |
55.6 |
471.4 |
254 |
1450 |
1397 |
411-1313 |
272-1117 |
|
Potassium |
K |
25.8 |
8.9 |
31.5 |
14.25 |
1079 |
467 |
315-974 |
137-330 |
|
Magnesium |
Mg |
20.5 |
29.7 |
47.1 |
137.2 |
90.2 |
279.6 |
23.9-32.2 |
75.0-254.6 |
|
Silicium |
Si |
11.01 |
11.58 |
12.99 |
30.58 |
59.86 |
85.76 |
14.67-54.97 |
23.21-78.34 |
|
Copper |
Cu |
8.5 |
9.11 |
11.1 |
11.8 |
19 |
18 |
15.85-17.95 |
15.33-17.11 |
|
Iron |
Fe |
6.09 |
6.11 |
12.72 |
32.19 |
28.23 |
12.42 |
8.4 -26.02 |
6.74-11.79 |
|
Aluminum |
Al |
2.7 |
1.86 |
6.54 |
4.74 |
17.49 |
14.29 |
5.14 -16.01 |
5.59-13.06 |
|
Boron |
B |
0.771 |
0.472 |
2.21 |
1.04 |
6.51 |
3.89 |
2.49-5.94 |
1.48-2.55 |
|
Strontium |
Sr |
0.42 |
0.85 |
0.867 |
1.28 |
3.12 |
7.26 |
1.23-2.85 |
2.77-6.62 |
|
Chromium |
Cr |
0.212 |
0.389 |
0.397 |
0.317 |
0.867 |
0.626 |
0.197-0.588 |
0.231-0.395 |
|
Iodine |
I |
0.15 |
0.15 |
0.482 |
0.508 |
1.765 |
1.96 |
0.436-1.603 |
0.257-0.531 |
|
Selenium |
Se |
0.134 |
0.078 |
0.346 |
0.269 |
0.701 |
0.623 |
0.304-0.644 |
0.233-0.569 |
|
Nickel |
Ni |
0.098 |
0.15 |
0.215 |
0.351 |
0.432 |
0.926 |
0.100-0.300 |
0.233-0.600 |
|
Manganese |
Mn |
0.09 |
0.091 |
0.1 |
0.118 |
0.749 |
0.628 |
0.288-0.863 |
0.253-0.574 |
|
nano g∙g-1 |
|||||||||
|
Molybdenum |
Mo |
34 |
27 |
49 |
39 |
71 |
57 |
45-67 |
44-76 |
|
Silver |
Ag |
15 |
15 |
50 |
76 |
22 |
69.5 |
75-195 |
22-63 |
|
Lithium |
Li |
15 |
14 |
28 |
25 |
100 |
86 |
42-92 |
36-79 |
|
Cobalt |
Co |
6 |
9 |
14 |
28 |
22 |
74 |
49-74 |
41-79 |
|
Gold |
Au |
7 |
7 |
30 |
34 |
61 |
90 |
16-55 |
27-87 |
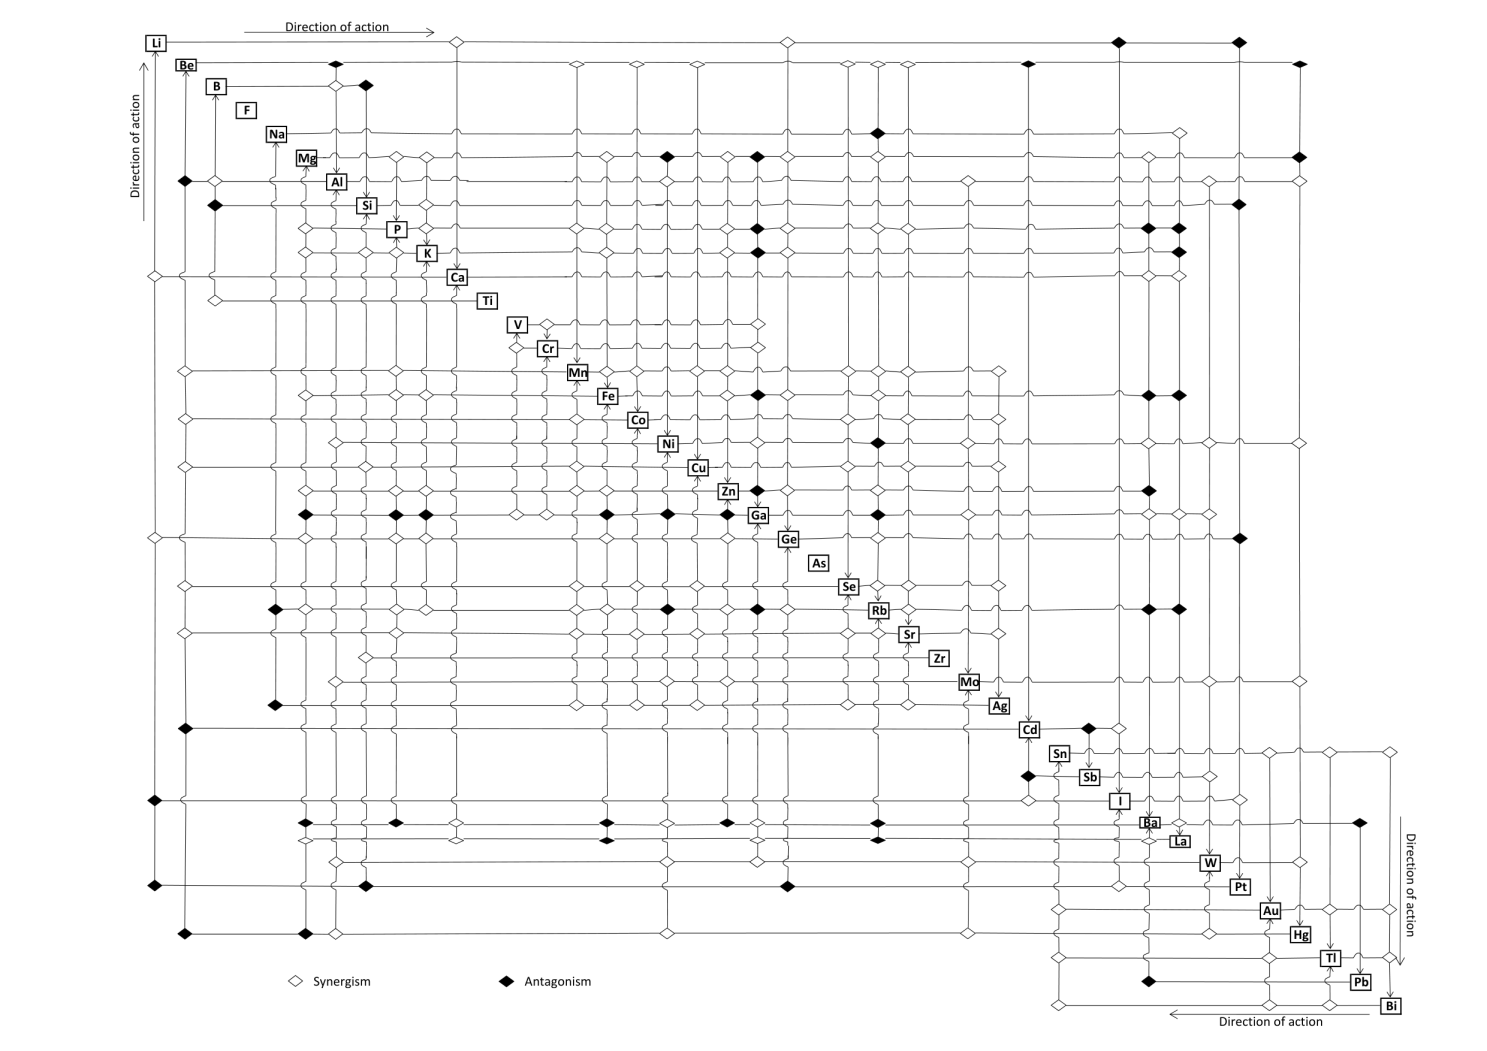
Figure 1. Bioelement interactions.
Since different group data Medians may slide up and down along the linear slope of a given element sigmoid saturation curve, it is relatively easy to visually identify if there is some group effect or not. Our Nutritional assessment is pretty much conclusive, indicating that the group size needs to be somewhere close to about 300 samples per group to generate the reliably stable Medians of the groups. Thus, our study on selenium nutritional status revealed how the hair selenium was slowly growing from very low levels in the flatland of Holland and Belgium, growing slowly over France, Italy and Russia, to reach high adequate levels in the Uygur Province of the People Republic of China [13]. What are the health implications of such diversity in selenium nutritional status on human health are unknown. However, the data indicates how highly abundant selenium status is related to the increased chance of acquiring adult diabetes mellitus.
Having available the reference values of adequate bio element nutritional status offered us the possibility of using the multi bio element nutritional status to study the complex bio element entanglement in a new way. For example, the cystic fibrosis, i.e., the failure of chloride metabolism is followed by problems with sodium metabolism since sodium is intimately related to chloride (NaCl). Looks simple but, however, chloride skin exc4retion can be accurately measured at some three laboratories in the entire world. However, it’s not only that sodium and chloride are involved since potassium is also entangled with sodium. That observation directed us to use the hair K/Na ratio for help in diagnosing the cystic fibrosis [14]. Analysis of hair bio element clustering in diseases, offers a new approach in both diagnosis and adequate treatment of various diseases. Indeed, assessing the nutritional status of sodium and potassium revealed inconsistency in the current dogma of ascribing the current level of population intake of dietary salt to essential hypertension [15].
It is pertinent to note here at the end of this short assay, that the reliable hair bio element reference values opens the possibility of study of bio element nutritional status in pregnant and lactating women and in their infants and children, without current restrictions which apply for such a vulnerable segments of the population. There are no more ethical contraindications to collect their hair and analyze it for assessing their nutritional status. Indeed, children’s brains accumulate more heavy metals like lead [16], so that the population exposure to heavy metals is and should be of great concern.
REFERENCES
- Momčilović B, Prejac J, Skalny AV, Mimica N. (2018). In search of decoding the syntax of the bioelements in human hair-A critical overview. J Trace Elem Med Biol. 50:543-553.
- Rook A, Dawber R. (1982). Diseases of the hair and scalp. Oxford, United Kingdom: Blackwell Sciemtific Publication.
- Momčilović B, Prejac J, Brundić S, Morović S, Skaqlny AV, M imica N, et al. (2019). An essay on human and elements, multi element profiles, qand depression. Translation Neurosci. 1:322-334.
- Diah K, Wang Q. (2022). A probabilistic Boolean model on hair follicle cell fate regulation by TGF beta. Biophysa J. 121(13):3638-3652.
- Momčilović B, Belonje B, Giroux A, Shah BG. (1976). Bioavailability of zinc in milk and soy prot3ein based infant formulas. J Nutr. 106(7):913-917.
- Momčilović B, Reeves PG, Blacke MJH. (1977). Idiorrhythmic dose-rate variability in dietary zinc intake generates a different response pattern of zinc metabolism than conventional dose-response feeding. Brit J Nutr. 78(1):173-191.
- Finney DJ. (1952). Probit Analysis. A statistical treatment of the sigmoid response curve. 2nd edn. Oxford, United Kingdom: Oxford Univ Prress.
- Willard S. (1970). General Topology. Boston, USA: Addison Wessley.
- Momčilović B, Prejac J, Višnjević V, Mimica N, Morović S, ČelebićA, et al. (2012). Environmental human silver exposure. Toxicol Environ Chem. 94(6):1238-1245.
- Morović S, Višnjević V, MorovićJ, Lykken GI, Skalny AV, Momčilović B, et al. (2022). The hair goleden range yardstick for assessing the optimal bioelement Nutritional status. Open J Nutr Food Sci. 4(2):35-44.
- Morović S, Moroviš J, Pižl Z, Momčilović B. (2022). Sex does matter. Assessing magnesiym and cxalcium Nutritional status with hair Median Derivattives Bioassayt. Mathews J Nutr Diet. 6(1):22.
- Momčilović B, Morović J, Prejac J, Skalny AV, Ivičić N. (1998). Trace element profile of human depression-the tapestry of patterns. Trace Elements and Electrolytes. 25(10):187-190.
- Prejac J, Morović S, Drmić S, Morović J, Pišl Z, Momčilović B. (2022). New way to assess the bio element selenium Nutritional status non invasively in vivo. Trace Elements in Medicine. 23(2):6-15.
- Momčilovič B. (2023). Hair potassium and sodium in cystic fibrosis. Endocrinol. Metab Nutr. 2(1):1-2.
- Momčilović B. (2021). Dietary salt in the whirl of Nutritional Science, Public Health, and Food processingt Industry. Trace Elements in Medicine. 22(4):3-13.
- Momčilović B, Kostial K. (1974). Kinetics of lead retention and distribution in suckling and adult rats. Environ Res. 8(2):214-220.