Information Links
Related Conferences
Previous Issues Volume 7, Issue 2 - 2023
Prevalence and Prediction of Obesity among Yemeni Hypertensive Patients: A Single-Center, Cross-Sectional Study
Mohammed Abdul-Malik Ghalib1, Abdul Kafi Shujaa Adeen2, Taha Al‑Maimoony2, Abdulhafeedh Al-Habeet3,*
1Master of Cardiology, Faculty of Medicine and Health Sciences, Sana'a University, Yemen
2Associate Professor of Cardiology, Faculty of Medicine and Health Sciences, Sana'a University, Yemen
3Master of Epidemiology and Biostatistics, District Sales Manager at Shaphaco Pharmaceutical Industries, Sana’a City, Yemen
*Corresponding Author: Abdulhafeedh Al-Habeet, Master of Epidemiology and Biostatistics, District Sales Manager at Shaphaco Pharmaceutical Industries, Sana’a City, Yemen, Phone: 0967775586642; E-mail: [email protected].
Received Date: August 04, 2023
Published Date: August 23, 2023
Citation: Ghalib MA, et al. (2023). Prevalence and Prediction of Obesity among Yemeni Hypertensive Patients: A Single-Center, Cross-Sectional Study. Mathews J Cardiol. 7(2):28.
Copyrights: Ghalib MA, et al. © (2023).
ABSTRACT
Background: Obesity and hypertension (HTN) are two of the most common chronic diseases in the world. They are also closely linked, with obesity being a major risk factor for HTN, and the two conditions often coexist. In this study, we aimed to determine the prevalence and predictors of obesity among hypertensive patients. Patients and Methods: This was a cross-sectional study that included all hypertensive patients on medications and/or patients with blood pressure (BP) over 140/90 mmHg who attended an outpatient cardiac clinic in Al-Thawra Modern General Hospital, Sana’a City, Yemen, between August 2021 and October 2022. Data was collected based on a face-to-face interview with participants. For the diagnosis of obesity, we relied on three anthropometric indicators: body mass index (BMI), waist circumference (WC), and waist-to-hip ratio (WHR). Results: A total of 271 hypertensive patients were enrolled in our study (46.5% were men and 53.5% were women, with a mean age of 56.4 ± 10.9 years). The prevalence of obesity determined by BMI, WC, and WHR was 27.6%, 55%, and 83%, respectively. Using multivariate logistic analysis, we found that age under 60 (Adjusted odd ratio (AOR): 2.01, 95% confidence interval (CI): 1.11-3.66, p-value: 0.022), female gender (AOR: 2.52, 95% CI: 1.14-5.55, p-value: 0.022), sleep duration of more than six hours per night (AOR: 0.50, 95% CI: 0.27-0.93, p-value: 0.027), sedentary lifestyle (AOR: 1.36, 95% CI: 0.57-1.65, p-value: 0.021), uric acid (AOR: 1.23, 95% CI: 1.01-1.49, p-value: 0.043), and left ventricular mass index (AOR: 0.98, 95% CI: 0.96-1.11, p-value: 0.002) were independent predictors of obesity among hypertensive patients. Conclusion: Our study demonstrated a high prevalence of obesity, particularly abdominal obesity, among hypertensive patients. It is crucial for hypertensive patients, especially those who are obese, to work closely with healthcare professionals to manage their condition effectively.
Keywords: Obesity, Overweight, Hypertension, Cardiovascular Diseases, Noncommunicable Diseases, Sana’a City, Yemen.
INTRODUCTION
Obesity and HTN are two of the most common chronic diseases in the world. They are also closely linked, with obesity being a major risk factor for HTN [1]. It has been observed that obese individuals are more likely to develop HTN compared to those with a healthy weight. The prevalence of HTN increases progressively with increasing BMI and WC, which are commonly, used indicators of obesity [2]. The mechanisms underlying the link between obesity and HTN are multifactorial and involve various physiological and metabolic processes. One key factor is the activation of the renin-angiotensin-aldosterone system (RAAS), which plays a crucial role in regulating BP. Adipose tissue, particularly visceral fat, produces various bioactive substances called adipokines, including angiotensinogen, which can stimulate the RAAS and contribute to HTN [3]. Another factor is that excess body weight increases the workload on the heart, which can lead to higher BP. Obesity can also lead to changes in the body's metabolism, which can also contribute to HTN [2]. In addition to the factors mentioned above, there are a few other factors explained the links between obesity and HTN. One factor is inflammation. Obesity is associated with chronic inflammation, which can damage the lining of blood vessels and lead to narrowing of the arteries. This narrowing can increase BP [4,5]. Additionally, obesity can lead to changes in the production of hormones such as insulin and aldosterone. These hormones can also affect BP [6]. Obese individuals are more likely to have sedentary lifestyles, consume unhealthy diets, and experience psychological stress, all of which can independently contribute to the development and progression of HTN [7].
The impact of HTN and obesity extends beyond cardiovascular health (CVH). Both conditions are associated with an increased risk of other chronic diseases, such as type 2 diabetes mellitus (T2DM), certain types of cancer, and sleep apnea. Moreover, the combination of HTN and obesity can lead to a vicious cycle, as HTN can worsen obesity-related complications and obesity can further elevate BP levels [6,8].
Obesity and HTN have quickly become serious global health threats. During the last decade, obesity and HTN have become more common in both developed and developing countries [5,9-11], and Yemen is no exception. In Yemen, there is an alarming prevalence of HTN among the urban population, reaching 41% [12]. It is estimated that obesity accounts for up to 78% of cases of primary HTN [13], and it is increasing the risk of developing T2DM, coronary artery diseases, and heart failure [14]. The prevalence of obesity among hypertensive patients is high. A study published in 2020 found that over 75% of hypertensive patients in Saudi Arabia were overweight or obese [10].
Understanding the complex relationship between these conditions is essential for implementing effective preventive measures and comprehensive treatment strategies to reduce the burden of cardiovascular diseases (CVDs) associated with these conditions and ultimately promote better CVH and overall well-being. Furthermore, controlling HTN in obese patients is critical for avoiding heart, renal, and other consequences. Indeed, the BP of obese patients appears to be more difficult to control, and obesity is recognized as a prevalent cause of treatment-resistant HTN [14].
Consistent and comparable studies of the prevalence of obesity among hypertensive patients in Yemen are necessary to guide public policy and offer benchmarks for decision-makers. In this study, we aimed to determine the prevalence and predictors of obesity among hypertensive patients. Our study fills the gap in research on this topic in our local area and encourages further research in the future. The findings of this study could also have considerable policy implications for every cardiologist in addressing the problem of these conditions.
PATIENTS AND METHODS
Study Design and Participants
This was a cross-sectional study conducted between August 2021 and October 2022 to determine the prevalence and predictors of obesity among hypertensive patients attending outpatient cardiac clinics in Al-Thawra Modern General Hospital, Sana’a City, Yemen. We included all patients with primary HTN who were aged between 18 and 85 years and agreed to participate. Secondary hypertensive patients, pregnant women and/or pregnant women with pregnancy-induced HTN, and patients who have had bariatric surgery were excluded from the final analysis.
Sample Size Calculation
The minimum required sample size was calculated using the following formula:
.PNG)
Where: n = minimum required sample size.
Z = 1.96 for a confidence level (α) of 95%.
p = expected prevalence of obesity among hypertensive patients was nearly 77% according to study conducted by AlMarri and Al-Hamad in Saudi Arabia [7], and
e = margin of error (5%)
Therefore, .PNG)
Accordingly, the final sample size is 271 hypertensive patients.
Data Collection, Tools and Measurements
A face-to face interview with hypertensive patients was administered using a pre-prepared questionnaire that covered the following data: sociodemographic attributes (age, gender, educational level, marital and occupational statuses, and residence), personal and dietary habits (Khat chewing, sleeping hours, and number of meals per day), as well as comorbidities, such as HTN and diabetes mellitus (DM). A sedentary lifestyle is defined as 5000 steps per day [15].
Measurements of Anthropometries
Anthropometric measurements, such as height, weight, WC, and Hip Circumference (HC) were obtained. After instructing the participants to take off shoes, heavy clothes, and a belt (Jambiya), as well as taking all the different anthropometric measurements. A portable ShorrBoard was used to measure height to the closest 0.1 cm. Body weight was measured to the closest 0.1 kg using a Balance Non-Digital scale (SCOEHNLE CERTIFIED classic XL). The BMI was computed by dividing the body weight in kilograms by the square of the height in meters. With participants in a standing position, WC was measured using an anthropometric tape placed horizontally, halfway between the costal border and the iliac crest. At the largest posterior extension of the buttocks, HC was measured. At the end of a mild expiration, the reading was taken. All anthropometric measurements were taken three times using a standard method of anthropometric assessment. The WHR is also computed by dividing WC by HC. Obesity was defined using a BMI of ≥ 30 (weight in kg divided by the square of height in m). Abdominal obesity was defined according to the WHO criteria as a WC ≥ 94 cm for men and ≥ 80 cm for women [16] or a WHR ≥ 0.90 in men and ≥ 0.85 in women [17].
Measurements of Blood Pressure
In the sitting position, BP was measured in both arms with a standardized mercury column sphygmomanometer and stethoscope. Before the measurements, the participants rested in a sitting position with their backs supported in ideal room conditions for 3-5 minutes. All participants were instructed to stop smoking or drinking tea or coffee for at least 30 minutes. For all participants, the Arm was bare, supported, and kept at heart level. The lower edge of the cuff was sited 3 cm above the elbow crease, with the bladder centered over the brachial artery, Legs uncrossed, and Feet flat on the floor. The BP measurement was done by using a standard bladder cuff (12–13 cm wide and 35 cm long) for most patients, but larger and smaller cuffs were used for participants who have larger and thinner arms, respectively. Each participant’s BP was measured three times, with one-minute intervals between measurements. Then the average of the 2nd and 3rd readings was accepted as the final value for defining HTN. To the nearest 2 mmHg, SBP was regarded as the 1st Korotkoff sound phase and DBP as the 5th phase (sound disappearance). According to Williams et al., participants with SBP ≥ 140 and/or DBP ≥ 90 mmHg were considered hypertensive patients [12]. In addition, participants were considered hypertensive regardless of their BP if they were taking antihypertensive(s) or changing their lifestyle to manage HTN.
Echocardiographic measurements
Vivid 7 color Doppler ultrasound diagnostic instrument was used to perform echocardiogram. The patient was situated in the left lateral decubitus position and breathed quietly during the examination. The left atrial diameter (LAD), left ventricular end-diastolic diameter (LVEDD), interventricular septal end-diastolic thickness (IVST), and left ventricular posterior wall end-diastolic thickness (LVPWT) were measured from the left sternal margin by a parasternal long or short axis window at the level of the mitral chords using a 2D-targeted M-mode echocardiograph. Using the leading-edge-to-leading-edge approach in the parasternal long-axis view, we determined the maximum distance between the end-systolic posterior wall of the aorta root and the posterior wall of the left atrium as measurement of LAD. The left atrial diameter index (LADI) is calculated as LAD/height [13]. Evaluation of early diastolic mitral velocity (E) and late diastolic mitral flow (A) by Doppler echocardiography was calculated as the E/A Ratio. The guidelines from the American Academy of Echocardiography were followed for the calculation of left ventricular mass (LVM) by using the Devereux correction formula: LVM (g) = 0.8 × [1.04 × {(LVEDd + PWTd + IVSTd)3 - (LVEDd)3}] + 0.6. Left ventricular mass index (LVMI) was calculated as LVM/ BSA (g/m2), and left ventricular hypertrophy (LVH) diagnosis criteria: LVMI ≥ 115 g/m2 (male), ≥ 95 g/m2 (female) [14]. Aortic root dilation was defined as an aortic root diameter greater than 37 mm for men and 34 mm for women [15].
Statistical Analysis
We used a packaged computer analysis program, the statistical package for social science (SPSS 28.0, IBM Corp., Armonk, NY, USA), for the statistical analysis of this data. A Shapiro-Wilk test confirmed that all continuous variables were normally distributed. Therefore, we stated all continuous variables as the means with standard deviation (SD), and we used Student’s t-test for comparisons. We used a chi-squared test to compare variables by obesity, and we presented the results as frequencies (n) and percentages (%). To determine the independent predictors of obesity, we used a binary logistic regression analysis yielding crude odds ratios (COR), and we reported corresponding 95% CI. Then, we performed an adjusted multivariate logistic analysis for age, gender, socio-demographic attributes, educational level, and history of diabetes simultaneously. We carried out an adjusted multivariate logistic analysis to establish the independent predictors of obesity for the study sample. We adjusted the study for confounders by entering them as covariates in the model. We checked multicollinearity between independent variables with standard error, and then we assessed model fitness using Hosmer and Lemeshow goodness of fit test. We reported AOR to show the strength of association. To investigate and compare the ability of obesity indicators to predict an elevated BP (SBP ≥ 140 and/or DBP ≥ 90 mmHg), we generated receiver operating characteristic curves (ROC) in both genders. We considered that the closer the area under curve (AUC) is to 1, the better the model, and the closer it is to 0.5, the poorer the model. A probability of p-value < 0.05 was considered statistically significant.
RESULTS
Sociodemographic characteristics of hypertensive patients
Based on the inclusion and exclusion criteria, a total of 271 hypertensive patients were included in our final data analysis. Among them, 145 (53.5%) were female. The mean age of patients was 56.4 ± 10.9 years, ranging from 29 to 85 years. More than half of patients were from urban areas 142 (52.4%). The most prevalent occupational status group was unemployed/ retired 223 (82.3%). The majority of patients were married 240 (88.6%). More than half of patients were illiterate 152 (56.1%) (Table 1).
Table 1. Sociodemographic characteristics of hypertensive patients
|
Sociodemographic characteristics |
Frequency (%) |
|
Gender |
|
|
Males |
126 (46.5) |
|
Females |
145 (53.5) |
|
Age groups (Years) |
|
|
< 60 |
130 (48.0) |
|
≥ 60 |
141 (52.0) |
|
Mean age = 56.4 ± 10.9 years |
|
|
Residence |
|
|
Urban |
142 (52.4) |
|
Rural |
129 (47.6) |
|
Occupational status |
|
|
Employee |
48 (17.7) |
|
Unemployed/ retired |
223 (82.3) |
|
Marital status |
|
|
Single/ widow |
31 (11.4) |
|
Married |
240 (88.6) |
|
Educational level |
|
|
Illiterate |
152 (56.1) |
|
Educated |
119 (43.9) |
The means of BMI, WC and WHR were 27.1±5.1 kg/m2, 97±13.5 cm, and 0.94±0.6 mm respectively. The Table 2 shows that the distribution of patients according to BMI categories underweight, normal weight, overweight, obesity class I, II and III was 6 (2.2%), 97 (35.8%), 93 (34.3%), 52 (19.2%), 18 (6.6%), and 5 (1.8%) respectively. The prevalence of overweight (BMI ≥25<30 kg/m2) and obesity (BMI ≥30 kg/m2) was 34.3% and 27.6% respectively. The prevalence of abdominal obesity determined by WC and WHR was 149 (55%), and 225 (83.0%) respectively.
Table 2. Distribution of hypertensive patients according to BMI categories, and prevalence of abdominal obesity determined by BMI, WC, and WHR
|
BMI Categories |
Frequency (%) |
|
Underweight |
6 (2.2) |
|
Normal weight |
97 (35.8) |
|
Pre-obesity or overweight |
93 (34.3) |
|
Obesity class I |
52 (19.2) |
|
Obesity class II |
18 (6.6) |
|
Obesity class III |
5 (1.8) |
|
Overall obesity determined by BMI |
75 (27.6) |
|
Abdominal obesity determined by WC |
149 (55) |
|
Abdominal obesity determined by WHR |
225 (83.0) |
Table 3 demonstrates the comparison of studied variables between obese and non-obese hypertensive patients as well as the crude odds Ratio (COR) and 95% CI using univariate logistic regression analytics. Hypertensive patients aged less than 60 years, females, and patients with a sedentary lifestyle were nearly 2-fold more likely to be obese (Crude Odd Ratio (COR): 2.28, 95% CI: 1.32–3.95, p-value: 0.003), (COR: 1.96, 95% CI: 1.13–3.41, p-value: 0.017), and (COR: 2.01, CI: 1.23–3.58, p-value: 0.018), respectively). While LVMI had a negative relationship with obesity (COR: 0.98, 95% CI: 0.98–0.99, p-value: < 0.001), LVEF had a positive relationship with it (COR: 1.04, 95% CI: 1.02-1.07, p-value: 0.002). On the other hand, all other variables presented in the Table 3 showed that there were no significant associations between them and obesity (p-value ≥ 0.05).
Table 3. Comparison of studied variables between non-obese and obese hypertensive patients
|
Variables |
Total (n=271) |
Non-obese hypertensive patients (n=196) |
Obese hypertensive patients (n=75) |
COR (95% CI) |
P-value |
|
Age < 60, n (%) |
130 (48.0) |
83 (42.3) |
47 (62.7) |
2.28 (1.32-3.95) |
0.003* |
|
Females, n (%) |
145 (53.5) |
96 (49.0) |
49 (65.3) |
1.96 (1.13-3.41) |
0.017* |
|
Urban residence, n (%) |
142 (52.4) |
99 (50.5) |
43 (57.3) |
1.32 (0.77-2.25) |
0.327 |
|
Employee, n (%) |
48 (17.7) |
37 (18.9) |
11 (14.7) |
0.74 (0.35-1.54) |
0.417 |
|
Illiterate, n (%) |
152 (56.1) |
113 (57.7) |
39 (52.0) |
0.79 (0.46-1.36) |
0.402 |
|
Married, n (%) |
240 (88.6) |
177 (90.3) |
63 (84.0) |
0.56 (0.26-1.23) |
0.148 |
|
Khat chewer, n (%) |
145 (53.5) |
99 (50.5) |
46 (61.3) |
1.46 (0.86-2.49) |
0.164 |
|
Eating ≤ 2 meals/day, n (%) |
20 (7.4) |
13 (6.6) |
7 (9.3) |
1.45 (0.55-3.78) |
0.447 |
|
Sleeping ≤ 6 hrs/day, n (%) |
101 (37.2) |
80 (40.8) |
21 (28.0) |
0.56 (0.32-1.01) |
0.051 |
|
Sedentary lifestyle, n (%) |
107 (39.5) |
86 (43.9) |
21 (28.0) |
2.01 (1.23-3.58) |
0.018* |
|
DM, n (%) |
104 (38.4) |
74 (37.8) |
30 (40.0) |
1.20 (0.64-1.89) |
0.734 |
|
HTN duration years, mean (SD) |
6.9 (4.6) |
7.4 (5.1) |
6.7 (4.9) |
1.02 (0.97-1.06) |
0.109 |
|
SBP (mmHg), mean (SD) |
142 (24.9) |
144.3 (22.4) |
142.1 (25.8) |
1.00 (0.99-1.01) |
0.501 |
|
DBP (mmHg), mean (SD) |
88.5 (12.9) |
90.2 (12.3) |
87.8 (13.1) |
1.01 (0.99-1.04) |
0.258 |
|
UA (mg/dl), mean (SD) |
5.6 (1.6) |
5.7 (1.8) |
5.5 (1.5) |
1.07 (0.91-1.26) |
0.682 |
|
AF, n (%) |
12 (4.4) |
11 (5.6) |
1 (1.3) |
4.52 (0.57-35.6) |
0.152 |
|
AO size (mm), mean (SD) |
27.8 (3.9) |
27.2 (4.0) |
28.1 (3.8) |
0.95 (0.88-1.01) |
0.276 |
|
LVH, n (%) |
220 (81.2) |
161 (82.1) |
59 (78.7) |
0.80 (0.41-1.55) |
0.512 |
|
LVMI (g/m2), mean (SD) |
136.5 (42.5) |
142.7 (44.6) |
120.3 (31.5) |
0.98 (0.98-0.99) |
< 0.001* |
|
IVST (mm), mean (SD) |
12.1 (1.4) |
12.3 (1.3) |
12.1 (1.4) |
1.09 (0.90-1.32) |
0.169 |
|
LVPWT (mm), mean (SD) |
12.3 (1.4) |
12.3 (1.2) |
12.2 (1.5) |
1.05 (0.87-1.26) |
0.688 |
|
LVEF (%), mean (SD) |
55.6 (11.4) |
59.1 (8.5) |
54.3 (12.1) |
1.04 (1.02-1.07) |
0.002* |
AF: Atrial Fibrillation, AO: Aortic Root, DBP: Diastolic Blood Pressure, DM: Diabetes Mellitus, hrs; hours, HTN: Hypertension, IVST: Interventricular Septum Thickness, LVEF: Left Ventricular Ejection Fraction, LVH: Left-Ventricular Hypertrophy, LVMI: Left Ventricular Mass Index, LVPWT: Left Ventricular Posterior Wall End-Diastolic Thickness, SBP: Systolic Blood Pressure, UA: Uric Acid.
Predictors of Obesity among Hypertensive Patients
The results of multivariate logistic analysis are presented in Figure 1. After adjusting for multiple risk factors, hypertensive patients aged less than 60 years, females, and patients with a sedentary lifestyle were 2, 2.5, and 1.36 times more likely to be obese (AOR: 2.01, 95% CI: 1.11-3.660 p-value: 0.022), (AOR: 2.52, 95% CI: 1.14-5.55, p-value: 0.022), and (AOR: 1.36, 95% CI: 3.57-1.14, p-value: 0.021) respectively. Hypertensive patients who slept ≤ 6 hours per night were 49.7% less likely to be obese than those who slept > 6 hours per night (AOR: 0.50, 95% CI: 0.27–0.92, p-value: 0.027). UA had a positive relationship with obesity (AOR: 1.23, 95% CI: 1.01–1.49, p-value: 0.043). After adjusting for multiple risk factors, the inverse relationship between LVMI and obesity was still significant (AOR: 0.98, 95% CI: 0.96–1.11, p-value: 0.002).
.png)
Figure 1. Forest plot of multivariate logistic regression analysis of the predictors of obesity. AF: Atrial Fibrillation, AO: Aortic Root, DBP: Diastolic Blood Pressure, DM: Diabetes Mellitus, hrs; hours, HTN: Hypertension, IVST: Interventricular Septum Thickness, LVEF: Left Ventricular Ejection Fraction, LVH: Left-Ventricular Hypertrophy, LVMI: Left Ventricular Mass Index, LVPWT: Left Ventricular Posterior Wall End-Diastolic Thickness, SBP: Systolic Blood Pressure, UA: Uric Acid
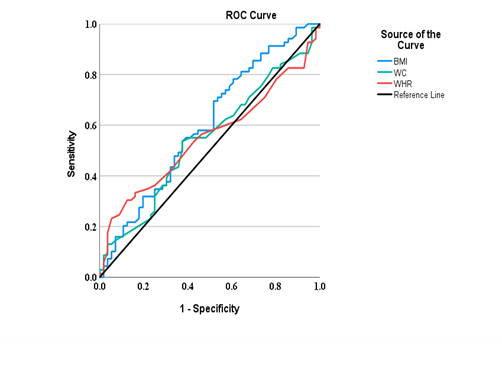
ROC Analytics of Obesity indices for Prediction of Elevated Blood Pressure in Patients with Hypertension
ROC curves for the prevalence of elevated BP in each sex are presented in Table 5 and Figure 2. Accordingly, all obesity indices did not exhibit predictive power in detecting an elevated BP (SBP ≥ 140 and/or DBP ≥ 90 mmHg); however, BMI showed the highest discriminative power for elevated BP at 0.603 (95% CI: 0.500–0.707) in men and 0.557 (95% CI: 0.458–0.657) in women. The discriminative powers of both WHR and WC for elevated BP were 0.563 (95% CI: 0.457–0.668) and 0.549 (0.444–0.655) respectively in men, while 0.495 (95% CI: 0.939–0.596) and 0.500 (95% CI: 0.400-0.600) respectively in women.
Table 5. Area under the ROC curve (AUC), confidence interval (CI), optimal cut-off values, sensitivities, and specificities of obesity indices in predicting elevated blood pressure
|
Obesity indices |
AUC (95% CI) |
Cutoff value |
Sensitivity |
Specificity |
P-value |
|
Men |
|||||
|
BMI |
0.603 (0.500-0.707) |
26.36 |
0.593 |
0.554 |
0.056 |
|
WHR |
0.563 (0.457-0.668) |
0.955 |
0.588 |
0.536 |
0.248 |
|
WC |
0.549 (0.444-0.655) |
93.5 |
0.559 |
0.500 |
0.363 |
|
Women |
|||||
|
BMI |
0.557 (0.458-0.657) |
26.62 |
0.627 |
0.521 |
0.389 |
|
WHR |
0.495 (0.939-0.596) |
0.965 |
0.492 |
0.507 |
0.680 |
|
WC |
0.500 (0.400-0.600) |
97.5 |
0.492 |
0.493 |
0.767 |
B) Women
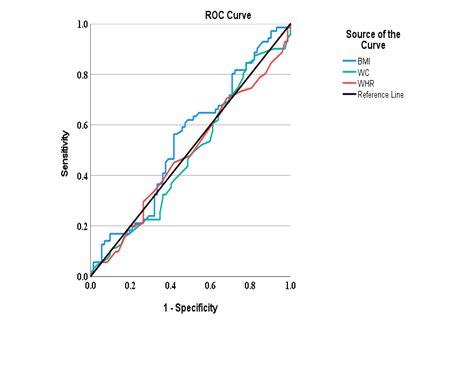
Figure 2. Comparison of the predictive performance of three obesity indices for the presence of elevated blood pressure. Receiver operating characteristic curves for elevated blood pressure in men (A) and in women (B) are shown. BMI: body mass index; WC: waist circumference; and WHR: waist-to-hip ratio
DISCUSSION
To our knowledge, this study is the first to report the prevalence and predictors of obesity among Yemeni hypertensive patients. There are two main findings in our study. First, while the prevalence of obesity determined by BMI was relatively similar to findings from other countries, the prevalence of obesity determined by WC and WHR was extremely high. Second, female gender, age < 60, sedentary lifestyle, sleep duration of more than six hours per night, and low LVMI were independent predictors of obesity among hypertensive patients.
Globally, both overweight and obesity are becoming increasingly common, and with them comes an increased burden of HTN and CVDs [21]. In addition, obesity plays a part in the etiology of HTN [22]. Although initially this epidemic was mostly seen in North America, Europe, and Pacific Islanders, overweight and obesity are gradually becoming more prevalent in the 3rd world, which is due to poor nutritional habits, sedentary lifestyles, increased urbanization, and the adoption of Western lifestyles [23], and Yemen is no exception. Our study revealed that 61.9% of hypertensive patients suffered from overweight and obesity (BMI ≥ 25 kg/m2). This finding seems in accordance with the prevalence of overweight and obesity estimated among hypertensive patients in Sri Lanka (64%) [24], but it is less than the findings of studies from Saudi Arabia and Bangladesh (96.6% and 70.7%, respectively) [9,25]. According to Mwenda et al. [26], 80.5% of Kenyan hypertensive and diabetic patients suffered from overweight and obesity.
Our study also demonstrated that the prevalence of obesity (BMI ≥ 30 kg/m2) among hypertensive patients was 27.6%. Our finding matched findings from Sri Lanka and Bangladesh by Mayurathan and Mannan et al., who reported that 28% and 32.3% of hypertensive patients were obese [24,25]; however, the prevalence of obesity among Saudi hypertensive patients seems to be extremely high (75.4%) [9]. Kenyan hypertensive and diabetic patients showed the lowest reported prevalence of obesity (23.1%) [26]. A direct positive correlation between BMI and BP may explain the high prevalence of obesity in hypertensive patients [27].
According to our study data, the prevalence of abdominal obesity determined by WC and WHR was extremely higher than the prevalence of general obesity determined by BMI among our cohort of hypertensive patients (55% and 83.0% vs. 27.6%, respectively). In Nigeria, the prevalence of abdominal obesity determined by WC and WHR was 88.9% and 74.2%, respectively [28]. There are a few reasons why the prevalence of abdominal obesity determined by WC or WHR was higher than the prevalence of general obesity determined by BMI among hypertensive patients. Abdominal fat is more metabolically active than other types of fat. This means that it releases more free fatty acids and inflammatory molecules, which can contribute to the development of HTN. WHR is a better predictor of cardiovascular risk than BMI. This is because WHR specifically measures the amount of fat around the abdomen, which is the most harmful type of fat. Hypertensive patients are more likely to have abdominal obesity than other people. This is because HTN is often caused by insulin resistance, which is also associated with abdominal obesity [29-33]. It is important to note that while WC and WHR are useful indicators of abdominal obesity, they do not capture the overall body fat percentage or distribution. BMI, on the other hand, provides a general measure of obesity based on height and weight but does not differentiate between fat and muscle mass. Therefore, the higher prevalence of abdominal obesity among hypertensive patients may be due to the specific factors mentioned above rather than a discrepancy between the measurements methods themselves.
In our study, the prevalence of obesity among hypertensive patients under 60 years of age was significantly higher compared to those aged 60 years and older. This finding is in keeping with findings from previous studies that were conducted in both China and Bangladesh [34,35]. However, in Saudi Arabia, AlMarri and Al-Hamad found no significant differences between both age groups [9]. Our finding can be attributed to several factors. First, people in their younger years tend to be more active and have healthier lifestyles than those in their older years. This is due to a number of factors, such as having more energy, being less likely to have health problems, and having more social opportunities to be active. As people age, they tend to become less active and eat more unhealthy foods. This can lead to weight gain and obesity. Second, younger patients may be more likely to be obese at the time they are diagnosed with HTN, while older patients may have gained weight after they were diagnosed. Additionally, younger patients may be more likely to be treated with medications that can cause weight gain, such as corticosteroids. Third, older individuals may have been living with HTN for a longer duration compared to younger individuals. Chronic HTN can lead to various complications and health issues, which may motivate older individuals to make lifestyle changes and manage their weight more effectively. Fourth, older individuals may have greater awareness of the health risks associated with obesity and HTN due to more frequent interactions with healthcare providers. They may also have better access to healthcare resources and interventions that can help manage their weight and BP. In addition to the factors mentioned above, there are a few other possible explanations for the difference in prevalence of obesity between younger and older hypertensive patients. For example, aging is associated with changes in metabolism, including a decrease in basal metabolic rate and muscle mass. These changes can make it more challenging for older individuals to gain weight or maintain obesity compared to younger individuals, who may have a higher metabolic rate and more muscle mass. Regardless of the reason, it is important for hypertensive patients to be aware of the increased risk of obesity as they age. This is because obesity can further increase the risk of developing other health problems, such as CVDs, stroke, and DM.
Gender is one of the most important risk factors for the development of obesity. After adjusting for multiple risk factors in our analysis, we found that women were 2.5 times more likely to be obese than their male counterparts, suggesting that female gender was an independent predictor of obesity among hypertensive patients. This is in line with the study’s finding by Kapoor et al. [36]. There are a few possible explanations for why female gender is a predictor of obesity among hypertensive patients. One possibility is that women have a higher body fat percentage than men, which makes them more likely to be obese. Another possibility is that women are more likely to have hormonal changes that can lead to weight gain, such as pregnancy and menopause. Moreover, gender differences may also depend on associated clinical comorbidities, such as T2DM, hypoventilation syndrome, nonalcoholic fatty liver disease, psychological disorders, pulmonary functions, and health-related quality of life, that more frequently impact women than men [37,38].
This is not surprising as sedentary lifestyle was an independent predictor of obesity in our cohort of patients, as evidence suggests that physical activity can be an important factor in the development of sustained negative energy balance conditions provided the volume of activity is high. Physical activity increases lipid substrate oxidation and may favor carbohydrate intake for the same amount of energy intake. Physical activity, such as walking, is a healthy course of action for the overweight or the obese patients [39].
Surprisingly, we found that people with HTN who slept more than 6 hours per night were more likely to be obese than people with HTN who slept less than or equal to 6 hours per night, suggesting that poor sleep may be associated with lower obesity rates. While there is a strong body of evidence supporting the association between inadequate sleep duration and obesity, it is important to note that the relationship between sleep and obesity is complex and can vary among individuals. One possible explanation for why more sleep was associated with higher obesity rates in our cohort of patients is that people who sleep more are more likely to be sedentary and have unhealthy diets. Another possible explanation is that sleep apnea, which is more common in people who sleep more, may contribute to obesity.
Interesting finding was that people with HTN who were obese had lower LVMI levels than people with HTN who were not obese. The reasons for this relationship are unclear. However, it is important to mention that it is crucial to interpret these findings cautiously and consider the broader context, including confounding factors, bidirectional relationships, individual variability, and the limited evidence available. Further research is also needed to establish a more definitive understanding of the relationship between LVMI and obesity in hypertensive patients.
We also used ROC analyses to predict the performance of three obesity indicators (BMI, WC, and WHR) for the presence of elevated BP (SBP ≥ 140 and/or DBP ≥ 90 mmHg). Accordingly, all obesity indicators were insignificantly associated with an elevated BP; however, BMI showed the highest AUC in both genders without reaching a significant relationship, suggesting that it may be a more accurate tool for predicting an elevated BP. In the literature, BMI was significantly related to HTN in Japanese women (AUC: 0.632) and in South African men (AUC: 0.603), while WC was significantly related to HTN in both genders in Taiwan (AUC: 0.640) and South African women (AUC: 0.640). WHR was significantly related to HTN in Japanese men (AUC: 0.606) [40-42]. It is important to mention that all the previous studies were community-based, which means that they included both hypertensive and normotensive patients. Therefore, the nature of our participants, who were all hypertensive patients, as well as their use of antihypertensive medications, may be related to the disappearance of significant relationships between all obesity indicators and an elevated BP in our cohort of patients.
LIMITATIONS
Our study has several limitations that must be acknowledged and should be considered when interpreting its findings. First, the causal relationship between obesity and HTN could not be established because of the cross-sectional design we used, which could only report on inferences. Second, it was a single-center study, therefore, it may have an inherent selection bias. Third, our study was limited to TMGH Hospital; hence, it cannot be generalized to other public and private hospitals. Despite these limitations, the cross-sectional design that we used in our study can provide valuable insights into the prevalence and associations between variables. However, our study should be interpreted cautiously, and its findings should be complemented by other study designs, such as prospective studies or randomized controlled trials, to establish causal relationships between obesity and HTN. We are planning to continue to extend the study prospectively in multicenter to achieve this endeavor.
CONCLUSION
In summary, our study demonstrated a high prevalence of obesity, particularly abdominal obesity, among hypertensive patients. Female gender, age under 60, sedentary lifestyle, a sleep duration of more than six hours per night, and low LVMI were independent predictors of obesity among hypertensive patients. It is crucial for hypertensive patients, especially those who are obese, to work closely with healthcare professionals to manage their condition effectively. Lifestyle modifications, including weight loss, regular physical activity, and a healthy diet, are recommended as part of the treatment plan to control HTN and reduce the associated risks of obesity.
ACKNOWLEDGMENTS
We wish to thank the Al-Thawra Modern General Hospital for allowing us to conduct this research. We are also grateful to the study participants who voluntarily agreed to be interviewed and participated in the study. Furthermore, we would like to thank Dr. Ahmed Ali Mohammed Alhareb for his contribution.
INFORMATION DISCLOSURE
Regarding the ethical considerations, hospital administration approval was obtained, and consent was obtained verbally from the participants after explaining the purpose of the research. A pre-structured questionnaire was completed for each record, and each was assigned a code for confidentiality and identification. We conducted the study in accordance with the Declaration of Helsinki by including basic principles of ensuring the study subject’s privacy, risk, and benefit, conducted by trained professionals, and even we allowed the right to withdraw if the study participants requested it. Moreover, the confidentiality of the information was assured. For the purpose of confidentiality, patients’ names were not used at the time of data collection; instead, a specific identification number was given for each patient. All other personal and health information was de identified and kept separately, so every effort was made to maintain confidentiality throughout the study period and afterwards. Besides, information obtained in the course of the study was only handled by the research team, and data were analyzed in aggregates.
CONFLICTS OF INTEREST
The authors declare no conflict of interest.
FINANCIAL SUPPORT AND SPONSORSHIP
Nil.
REFERENCES
- Shariq OA, McKenzie TJ. (2020). Obesity-related hypertension: a review of pathophysiology, management, and the role of metabolic surgery. Gland Surg. 9(1):80-93.
- Ostchega Y, Hughes JP, Terry A, Fakhouri TH, Miller I. (2012). Abdominal obesity, body mass index, and hypertension in US adults: NHANES 2007-2010. Am J Hypertens. 25(12):1271-1278.
- Konukoglu D. (2019). The Link Between Obesity and Hypertension Through Molecular Mechanisms. United Arab Emirates: Bentham Science Publishers.
- Seravalle G, Grassi G. (2017). Obesity and hypertension. Pharmacol Res. 122:1-7.
- Narkiewicz K. (2006). Obesity and hypertension--the issue is more complex than we thought. Nephrol Dial Transplant. 21(2):264-267.
- Qin X, Zhang Y, Cai Y, He M, Sun L, Fu J, et al. (2013). Prevalence of obesity, abdominal obesity and associated factors in hypertensive adults aged 45-75 years. Clin Nutr. 32(3):361-367.
- Litwin M, Kułaga Z. (2021). Obesity, metabolic syndrome, and primary hypertension. Pediatr Nephrol. 36(4):825-837.
- Rahimi E, Cheric MC. (2012). Prevalence of Overweight and Obesity and their relation to hypertension in adult male population of Fars province of Iran. Pak J Med Res. 51(3):97-100.
- AlMarri EA, Al-Hamad J. (2020). Prevalence of obesity among hypertensive patients in Primary Care Clinic, Security Forces Hospital, Riyadh, Saudi Arabia 2017-2018: A prospective cross-sectional study. J Family Med Prim Care. 9(4):1885-1890.
- Colosia AD, Palencia R, Khan S. (2013). Prevalence of hypertension and obesity in patients with type 2 diabetes mellitus in observational studies: a systematic literature review. Diabetes Metab Syndr Obes. 6:327-338.
- Gunaid AA. (2012). Obesity, overweight and underweight among adults in an urban community in Yemen. East Mediterr Health J. 18(12):1187-1193.
- Zhang Y, Hou LS, Tang WW, Xu F, Xu RH, Liu X, et al. (2019). High prevalence of obesity-related hypertension among adults aged 40 to 79 years in Southwest China. Sci Rep. 9(1):15838.
- Hall JE, do Carmo JM, da Silva AA, Wang Z, Hall ME. (2015). Obesity-induced hypertension: interaction of neurohumoral and renal mechanisms. Circ Res. 116(6):991-1006.
- Tudor-Locke C, Craig CL, Thyfault JP, Spence JC. (2013). A step-defined sedentary lifestyle index: <5000 steps/day. Appl Physiol Nutr Metab. 38(2):100-114.
- Organization WH. (2011). Waist circumference and waist-hip ratio: report of a WHO expert consultation, Geneva, 8-11 December 2008.
- Ashwell M, Gibson S. (2009). Waist to height ratio is a simple and effective obesity screening tool for cardiovascular risk factors: analysis of data from the British National Diet and Nutrition Survey of adults aged 19–64 years. Obes Facts. 2(2):97-103.
- Williams B, Mancia G, Spiering W, Agabiti Rosei E, Azizi M, Burnier M, et al. (2018). 2018 ESC/ESH Guidelines for the management of arterial hypertension: The Task Force for the management of arterial hypertension of the European Society of Cardiology (ESC) and the European Society of Hypertension (ESH). J Hypertens. 39(33):3021-3104.
- Armstrong AC, Liu K, Lewis CE, Sidney S, Colangelo LA, Kishi S, et al. (2014). Left atrial dimension and traditional cardiovascular risk factors predict 20-year clinical cardiovascular events in young healthy adults: the CARDIA study. Eur Heart J Cardiovasc Imaging. 15(8):893-899.
- Sun N, Chen J-W, Wang J, Xie L, Chen L, Mu J, et al. (2016). Asian expert consensus for the diagnosis and treatment of hypertension-associated left ventricular hypertrophy. Cardiology Plus. 1(3):37-47.
- Wang D, Xu JZ, Kang YY, Zhang W, Hu LX, Wang JG. (2022). Aortic Root Diameter in Hypertensive Patients with Various Stages of Obstructive Sleep Apnea. Am J Hypertens. 35(2):142-148.
- Landsberg L, Aronne LJ, Beilin LJ, Burke V, Igel LI, Lloyd-Jones D, Sowers J. (2013). Obesity-related hypertension: pathogenesis, cardiovascular risk, and treatment--a position paper of the The Obesity Society and The American Society of Hypertension. Obesity (Silver Spring). 21(1):8-24.
- Masuo K, Tuck ML, Lambert GW. (2011). Hypertension and diabetes in obesity. Int J Hypertens. 2011:695869.
- Hossain P, Kawar B, El Nahas M. (2007). Obesity and diabetes in the developing world—a growing challenge. N Engl J Med. 356(3):213-215.
- Mayurathan P. (2020). Prevalence of overweight, obesity and hypothyroidism among hypertensive patients at teaching hospital batticaloa. GARI International Journal of Multidisciplinary Research. 6(3).
- Mannan A, Akter KM, Akter F, Chy NUHA, Alam N, Pinky SD, et al. (2022). Association between comorbidity and health-related quality of life in a hypertensive population: a hospital-based study in Bangladesh. BMC Public Health. 22(1):181.
- Mwenda V, Njuguna J, Musa M. (2017). Prevalence of overweight and obesity among hypertensive and diabetic patients seeking care at a rural Kenyan hospital. The East and Central Africa Medical Journal. 3(1):26-29.
- Alderman MH. (1994). Non-pharmacological treatment of hypertension. The Lancet. 344(8918):307-311.
- Opara C, Maduka O. (2020). An Evaluation of Obesity and Hypertension among Prima-ry School Teachers in an Urban Region of South-South Nigeria. J Hypertens Manag. 6(1):050.
- Smith U. (2015). Abdominal obesity: a marker of ectopic fat accumulation. J Clin Invest. 125(5):1790-1792.
- Martín Castellanos Á, Cabañas Armesilla MD, Barca Durán FJ, Martín Castellanos P, Gómez Barrado JJ. (2017). Obesity and risk of myocardial infarction in a sample of European males. Waist to-hip-ratio presents information bias of the real risk of abdominal obesity. Nutricion hospitalaria. 34(1):88-95.
- Paley CA, Johnson MI. (2018). Abdominal obesity and metabolic syndrome: exercise as medicine? BMC Sports Sci Med Rehabil. 10:7.
- Fu L, Zhou Y, Sun J, Zhu Z, Tai S. (2022). Abdominal Obesity Is Associated with an Increased Risk of All-Cause Mortality in Males but Not in Females with HFpEF. Cardiovasc Ther. 2022:2950055.
- Li C, Ford ES, McGuire LC, Mokdad AH. (2007). Increasing trends in waist circumference and abdominal obesity among US adults. Obesity (Silver Spring). 15(1):216-224.
- Zhang Y, Zhang WQ, Tang WW, Zhang WY, Liu JX, Xu RH, et al. (2022). The prevalence of obesity-related hypertension among middle-aged and older adults in China. Front Public Health. 10:865870.
- Ali N, Ahmed S, Mahmood S, Trisha AD, Mahmud F. (2023). The prevalence and factors associated with obesity and hypertension in university academic staff: a cross-sectional study in Bangladesh. Sci Rep. 13(1):7309.
- Kapoor N, Arora S, Kalra S. (2021). Gender Disparities in People Living with Obesity-An Unchartered Territory. J Midlife Health. 12(2):103-107.
- Jonikas JA, Cook JA, Razzano LA, Steigman PJ, Hamilton MM, Swarbrick MA, et al. (2016). Associations between gender and obesity among adults with mental illnesses in a community health screening study. Community Ment Health J. 52(4):406-415.
- Atri A, Jiwanmall SA, Nandyal MB, Kattula D, Paravathareddy S, Paul TV, et al. (2020). The Prevalence and Predictors of Non-alcoholic Fatty Liver Disease in Morbidly Obese Women-A Cross-sectional Study from Southern India. Eur Endocrinol. 16(2):152-155.
- Naureen I, Saleem A, Naeem M. (2022). Effect of exercise and obesity on human physiology. Sch Bull. 8(1):17-24.
- Sakurai M, Miura K, Takamura T, Ota T, Ishizaki M, Morikawa Y, et al. (2006). Gender differences in the association between anthropometric indices of obesity and blood pressure in Japanese. Hypertens Res. 29(2):75-80.
- Lin Y-A, Chen Y-J, Tsao Y-C, Yeh W-C, Li W-C, Tzeng I-S, et al. (2019). Relationship between obesity indices and hypertension among middle-aged and elderly populations in Taiwan: A community-based, cross-sectional study. BMJ open. 9(10):e031660.
- Modjadji P, Salane MC, Mokwena KE, Mudau TS, Mphekgwana PM. (2022). Utility of Obesity Indicators for Predicting Hypertension among Older Persons in Limpopo Province, South Africa. Applied Sciences. 12(9):4697.