Information Links
Related Conferences
Previous Issues Volume 7, Issue 3 - 2022
Assessed Breastfeeding Knowledge, Attitude, and Practice and Identified Associated Factors
Asma Hawasawi1, Najia Alhojaili2,*, Hana Ahmed Al Bha3
1Consultant of Obstetrics and Gynecology, Maternity and Children’s Hospital, Makkah, Saudi Arabia
2NICU CONSULTANT, Maternity Children Hospital, Makkah, Saudi Arabia
3Senior Registrar in Obstetrics Gynecology, Maternity Children Hospital, Al Madina Almonawara, Saudi Arabia
*Corresponding Author: Dr. Najia Alhojaili, NICU Consultant, Maternity children hospital Makkah POBOX 8981, Saudi Arabia, Tel: 0569754397; E-mail: [email protected].
Received Date: December 14, 2022
Published Date: December 30, 2022
Citation: Alhojaili N, et al. (2022). Assessed Breastfeeding Knowledge, Attitude, and Practice and Identified Associated Factors. Mathews J Case Rep. 7(3):81.
Copyrights: Alhojaili N, et al. © (2022).
ABSTRACT
Assessment of Knowledge, Attitude and Practice of Breastfeeding and Associated Barriers, A Cross-Sectional Study in Maternal and Child Hospital Makkah, KSA, 2019. Background: Breastfeeding (BF) is now recognized worldwide to have great effects on both the mother and her baby. Method: This study was a descriptive cross-sectional hospital and community-based study. Conducted in Makkah for the community participants and Maternal and child hospital Makkah (MCHM). The study population comprised health care providers (HCP) and the women in MCHM and Makkah communities. A simple random technique was obtained to select 142 women. For the (HCP) we included all 31 HCPs in the hospital (total coverage). This study aimed to investigate the knowledge, attitude, and practice of breastfeeding and associated factors that affect compliance with breastfeeding among HCP and women in MCHM and Makkah community, KSA, 2019. Result: Most women get their knowledge about BF from family and a friend which gives chance to introduce wrong and untrusted information about BF and affects their attitudes and practices on BR. Generally, the knowledge about BR was good, while the attitude towards BR was negative towards BR (mainly from women from the community). Moreover, most of the participants agreed with all factors and barriers affecting BR. and there was a significant association between the knowledge and the attitude of the participants towards BF. Conclusion: There was a good chance to train and learn the required knowledge and practices of BR among the women even though they received full support to continue on BR and they are relatively younger and had high educational levels.
Keywords: Breastfeeding, Hospital, Human Breast Milk, Childhood, Cancers, Healthcare, Women.
ABBREVIATIONS
BF: Breastfeeding; HCP: Health Care Providers; MCHM: Maternal and Child Hospital Makkah; WHO: World Health Organization; GIT: Gastrointestinal Tract; EMRO: Eastern Mediterranean Regional Office; KSA: Kingdom of Saudi Arabia; HCFHS: Saudi Commission for Health Specialties; EBF: Exclusive Breastfeeding.
INTRODUCTION
Breastfeeding
WHO defines breastfeeding as breast milk received by the child either directly from the mother’s breast or from expressed one [1]. Breastfeeding now is recognized worldwide to have great effects on both the mother and her baby. In addition, human breast milk is no doubt the best source of nutrients and the required protective antibodies during the early life of the baby. Breast milk is developed using various transitional stages; which begin with colostrum, which is produced during the late gestation period to a few days after delivery. Colostrum is creamy, yellow-colored milk and is much thicker than the usual milk that is produced in the later stage [2]. Colostrum is known to be richer in protein, minerals, vitamins, and the all-important needed antibodies compared to the usual milk. In addition, as usual, the antibodies produced are playing role in protecting the baby from many acquired illness-causing bacteria roaming in the surrounding environment [2]. Therefore, Breastfeeding provides all the necessary fluid and nutrients needed for the growth and development of the infant until 4-6 months of age [2].
Exclusive breastfeeding (EBF)
EBF is defined as the feeding of the infant restricted on breast milk from his/her mother without any addition of other food or fluid (even water) [1]. However, minerals, vitamins, and medicines are allowed in addition to breast milk. In addition to the benefits of breastfeeding, it is known to be more effective when the infant is exclusively breastfed. So, Infants having complementary foods below the age of six months are reported to have higher mortality rates of gastrointestinal infections in comparison to infants who had (EBF) [3]. Again, children having (EBF) have lower incidence rates of diabetes and cancers during childhood [4,5]. In addition, (EBF) for the first six months of children’s life has been shown to supply all required nutrients for the baby and (EBF) not affect the development, growth, and health of the child [6].
WHO Breastfeeding Recommendations
WHO strongly recommends (EBF) for the first six months of life [7] then followed by the introduction of further complementary food and continued breastfeeding for at least two years and beyond [8]. Although, we found that many previous studies indicated that infants who had Baby Friendly Hospital Initiative (BFHI) were shown to have a reduced risk of acquiring one or more gastrointestinal tract infections [9].
Again, the WHO advises mothers to continue breastfeeding frequently and on-demand at least two years of age. Therefore, breastfeeding the infant is required as the baby wants, day and night times. However, WHO discouraged the use of bottles and pacifier teats, and this is due to fact that the high hygiene standards are needed for their safe use [8]. Again, WHO encourages health facilities that provide maternity services to have a full practice of the ten steps to successful breastfeeding.
Although, WHO recommends that every woman must have full access to support that giving by healthcare providers in enhance to help them to early initiate and continue breastfeeding and how to deal with the difficulties that may arise during the breastfeeding process. Moreover, enough knowledge is required for healthcare providers to provide support and guidance to women.
Breastfeeding Practice
(EBF) practices: However, there are high rates of initiation of breastfeeding (more than 90%), (and EBF) practices are still not common in a lot of countries. Now only approximately one-third of infants aged less than six months are having (EBF). Therefore, several variations in different regions are present (10). For example, East Asia has the highest rates of (EBF) accounting for 43%, and Eastern and Southern Africa accounted for 41%. Whereas the lowest reported region with (EBF) rate is Western and Central Africa (accounted just 20%) [10].
Benefits of Breastfeeding
Benefits of breastfeeding to children
Therefore, there are several benefits to breastfeeding which include both short-term and long-term benefits. For example, it enhances mental and motor development and reduces the incidence of common children’s diseases like gastrointestinal tract (GIT) infections, otitis media, upper respiratory tract infections, atopic eczema, and diarrhea [11,12].
Therefore, in general terms breastfeeding reduces infant mortality. We found several studies evidence that children who have (EBF) for the first three months, were fully protected from 55% of the infant mortality caused by diarrhea and acute respiratory infection in comparison to other babies [13].
However, many previous studies indicated that breastfed children had a higher intellectual score and better motor development tests in comparison to children who had no breastfeeding [14-16].
Furthermore, it has been established that infants who had (EBF) for the first six months tend to crawl earlier and they are able to sit earlier, and are more likely to start walking by age of 12 months [14].
Maternal Health Benefits of Breastfeeding
However, the early initiation of breastfeeding enhances the early release of the oxytocin hormone which leads to early uterine contractions and hence reduces postpartum bleeding [17]. However, (EBF) helps in spacing naturally and this spacing, in turn, leads to the elongation of birth intervals and therefore improvement of maternal and children’s health [18]. Furthermore, breastfeeding helps women to return to their pre-pregnancy weight faster than formula-feeding women. In addition, it forms a strong bond between mothers and their babies [17]. Again, breastfeeding reduces the risk of breast cancer [19,20] and ovarian cancer [21,22].
However, breastfeeding delays menstruation in mothers (up to 30 weeks) after delivery so, it lowers the risk of maternal iron deficiency anemia [17].
Breastfeeding in KSA
The Eastern Mediterranean Regional Office of WHO (EMRO) had a high rate (>60%) of early breastfeeding initiation and more than 60% of mothers continuing to breastfeed for up to 12 months in the Middle East and North Africa (MENA) countries [23]. Nevertheless, little data are found in the case of KSA as individual country profiles.
Factors that affect compliance with exclusive breastfeeding
Although, maternal knowledge about infant feeding and available options for breastfeeding affects and influences their practices [33]. Sometimes, cultural values and practices affect the use of colostrum; several cultures regard it unsuitable for infants. Besides, another factor is the perceptions of mothers regarding inadequate breast milk [33,34].
Antenatal Breastfeeding Education
Moreover, antenatal breastfeeding education is regarded as any breastfeeding information which is given to pregnant women in various forms. However, health education can be delivered in (13) form of an individual or group level, peer education programs, home visiting programs, or clinic appointments target increased awareness about breastfeeding [35].
Therefore, antenatal breastfeeding education no doubt has several positive outcomes on breastfeeding practices because it is reported to influence maternal decisions to initiate and continue breastfeeding. Therefore, antenatal breastfeeding education no doubt has several positive outcomes on breastfeeding practices because it is reported to influence maternal decisions to initiate and continue breastfeeding
Healthcare Providers and Breastfeeding
Moreover, the provision of health information about breastfeeding is reported as the most important factor that influences the initiation and continuation of breastfeeding [36,37].
On the other hand, if the support and advice given by healthcare providers were not adequate and appropriate, then the breastfeeding outcomes will be expected to be inappropriate or negative [38]. Therefore, healthcare providers who received inadequate training in breastfeeding counseling are expected to be less confident in their ability to support and advice women, thus they would have low competency in giving proper breastfeeding counseling [39].
However, several studies indicated that the majority of healthcare providers have little knowledge regarding proper breastfeeding so, they are not expected to give mothers sufficient, correct information and required support; even sometimes they do not provide it at all [40-42].
Barriers to Support Breastfeeding amongst Healthcare Providers
However, several studies have reported that there are many barriers inhibiting healthcare providers from providing good support to mothers regarding breastfeeding. Although, these factors include inadequate knowledge among healthcare providers regarding breastfeeding [43], lack of time to appropriate advice and counsel mothers and lack of personal experience in breastfeeding [44], and inadequate skills [45].
Problem statement
However, data on breastfeeding in the Kingdom of Saudi Arabia (KSA) are scarce which is required to monitor progress and develop promotion programs. Up to our knowledge, WHO reported inadequate data about breastfeeding in the KSA profile with little national data on breastfeeding [24,25].
Initiation rates were above 90% in almost all of the identified studies. One study found a considerable difference between urban and rural communities in initiation rates (90% for rural versus 76% for urban groups) [26].
In time to initiation of breastfeeding, El-Gilani et al. reported that only 11.4% of mothers started breastfeeding within the first hour after delivery [27] while Amin et al. found that 77.8% of studied mothers had initiated breastfeeding within 24 hours postpartum [28]. WHO reported that the ‘exclusive breastfeeding’ rate at six months of age ranged from 1.7% [29] to 24.4% [27]. Other studies found low rates of ‘exclusive breastfeeding at six months after birth: 0.8% [30]; 8.9% [31] and 5.6% [32].
Therefore, in this research, we aimed to shed the light and fill the gap in the knowledge, attitudes, and practice of both HCP and women in the Makkah community regarding breastfeeding and the associated factors that affect breastfeeding in KSA.
The Hypothesis
Alternative hypothesis: there is a difference between the knowledge attitude and practice of HCP and non-HCP regarding breastfeeding in the Maternal and Child hospital Makkah (MCHM) and Makkah community.
Null hypothesis: there is no difference between the knowledge attitude and practice of HCP and non-HCP regarding breastfeeding in MCHM and Makkah communities.
OBJECTIVE
General Objectives
This study aimed to investigate the knowledge, attitude, and practice of breastfeeding and associated factors that affect compliance with breastfeeding among HCP and women in MCHM and Makkah community, KSA, 2019.
Specific Objectives
- To measure the prevalence of breastfeeding initiation and exclusive breastfeeding in MCHM and Makkah community, KSA, 2018.
- To assess knowledge of breastfeeding among HCP and women in MCHM and Makkah communities.
- To assess attitudes toward breastfeeding among HCP and women in MCHM and Makkah communities.
- To assess the practice of breastfeeding among HCP and women in MCHM and Makkah communities.
- To compare the knowledge, attitude, and practice between HCP and non-HCP in MCHM and Makkah communities.
- To identify the factors influencing noncompliance to (EBF) in MCHM and Makkah communities.
- To identify barriers to breastfeeding in MCHM and Makkah community.
PATIENTS AND METHODS
Study design
This study was a descriptive cross-sectional hospital and community-based study.
Study area
The study was conducted in Makkah for the community participants and Maternal and child hospital Makkah (MCHM) for the patients admitted or received management.
Makkah is a city in the Hejazi region in the Arabian Peninsula, in the plain of Tihamah, Saudi Arabia, and it is also the capital and administrative headquarters of the Makkah Region (46). The city is located 70 km (43 miles) inland from Jeddah in a narrow valley at a height of 277 m (909 ft) above sea level, and 340 kilometers (210 mi) south of Medina. Its resident population in 2010 was 1684408 (47) although visitors more than triple this number every year during the Ḥajj.
MCHM
It is a major tertiary referral center hospital in Makkah, KSA. It receives both direct patients and inter-hospital referrals. It serves as a general hospital for more than 1.5 million inhabitants in Makkah and its environs. The hospital has a discrete Emergency Department (ED) with a resuscitation area and theatre along with separate departments of Obstetrics & Gynaecology and pediatrics. The hospital is well-established and structured in means of health care providers and facilities to deal with all patients and it provides preventive and curative services to the patients.
Study population
The study population comprised two groups: the first one was the health care provider (HCP) in MCHM and the second group was divided into two subgroups: the gravid women and mothers in the postnatal period in MCHM and Makkah community who were suitable and met the inclusion and exclusion criteria.
Inclusion and exclusion criteria
Inclusion criteria
- Any (HCP) consultant, doctor, or midwife working in the Gynecology department of MCHM and directly managing and attending to the delivery of the patients.
- Any gravid patient attended, was admitted, or was referred to MCHM during the study period.
- Any women (in the Makkah community) during the study period.
Exclusion criteria
- Any (HCP) did not work in the MCHM or not directly managed the pregnant women.
- Any patient was from outside of Makkah.
- Any woman was from outside of the Makkah community.
Sampling procedures
Sampling technique
A simple random technique was obtained to select the participant women. We selected the first woman from the MCHM then we miss the second and choose the third woman until reached the sample size. Again, we obtained the same random technique for the selection of women in the Makkah community. For the (HCP) we included all 31 consultants and doctors in the hospital (total coverage).
Sample size
Sample size for this study was determined by application of the following equation:

n=sample size.
Z=the normal standard deviate (z=1.96).
P=the frequency of occurrence of an event.
Q=1-p (the frequency of non-occurrence of an event).
D=degree of precision (0.05) %
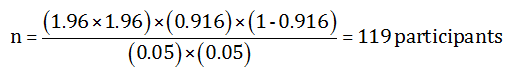
P=91.6 according to a nationwide nutritional survey conducted in 2004-2005 in KSA with sample of 5339 children which found that the prevalence of breastfeeding was 91.6 %.
q=1-p=1-0.916-0.084
We added further 23 women to study group (about 2054) of the sample size to guard against nor response rate to reach the total number of the patient as follow:
119+23=142 women
Therefore, we made a minimum sample size of 142 women (One hundred and forty-two). Then we divided this number into two groups (hospital and community) as follows: 142/2 = 71 women from the community, and 71 women from the hospital. This sample was selected to give 80% power with a precision of 5%.
Study period
The study period extended to three consecutive months starting from 1st September up to 31st November 2018. 3.7. Data collection tools: Tools for this study were based on WHO guidelines for breastfeeding and notes from the consultant of obstetrics and gynecology working in MCHM. Tools for this study were two structured, standardized questionnaires; the first one was assigned to collect data from the (HCP) that were working at MCHM, while the second one was assigned to the women in the MCHM or women selected from the Makkah community. Doctors and nurses filled out both two questionnaires. They trained to be familiar with the questionnaire, the nature of the questions, and how to deal with the privacy of the participants. A pretest check for the questionnaire was applied before the start of the study to deal with the validity of the questions, time, language, and acceptability of the questions.
Questionnaires
The first questionnaire was filled out by trained doctors and nurses in the delivery room and obstetrics wards in MCHM and the second one was filled out by the investigator for the women in the Makkah community. Trained interviewers were present at the delivery room and obstetrics departments to capture all included participants. Interviewers filled out the questionnaire designated for this study after obtaining verbal informed consent from the participants. The questionnaire contained detailed data on the demographic features of participants, knowledge, attitude, and practice of the HCP and women regarding breastfeeding along with the factors that affect compliance with breastfeeding
Pre-testing and validation of study tool
A pre-test of the questionnaire was obtained one week prior to the study date. Trained doctors and nurses with enough experience working in the (MCHM) collected the data from the patients. They worked as a research assistant; interviewed the participants by using a structured questionnaire. The result of this pre-test was used in order to examine the practicability and reliability of the questions. Then the study questionnaires were adjusted accordingly. 3.8. Data processing and analysis: 3.8.1. Data management: After the collection of data, questionnaires were checked, and data was entered into the computer, using Statistical Package for the Social Science (SPSS version 25.0 for Windows) and double-checked before analysis. The results were illustrated in a form of frequency tables and text calculating the means and standard deviation (SD) for continuous variables, frequencies, and percentages for categorical variables to describe participant responses. Chi-square and Fisher's exact tests were applied to analyze categorical data. Variables with a P-value of < 0.5 in univariate analysis were entered into analysis P-value < 0.05 was considered a significant level.
Ethical considerations
Verbal invitations were obtained to potential participants and consent was received before issuing questionnaires. Ethical clearance and authority to carry out this study was obtained from the Saudi commission for health specialties (SCFHS) to conduct this study. Prior to any interview, the interviewer has given participants an explanation of the purpose, nature, and benefits of the study, if they agreed to participate, then they were included in the study group. Confidentiality of data and privacy were rigorously protected. The research team members have trained adequately in this aspect. Access to the confidential data would be limited to the researcher.
Results 1: Sampling selection of the participants. Table 1 & figure 1 shows the category of the participant, as we selected the participants according to the sample size equation for the women from the hospital and from the community of Makkah and they constituted 82% of the total sample (41% for each one equally), and for the HCP participant we selected them from the hospital (all of the HCPs who were working at the hospital at the time of the collecting data) and the HCP were 31 which constituted 18% of the total participants.
Table 1. Frequency distribution of the type of participants (n = 173).
|
Type of participants |
Frequency |
Percent |
|
From Hospital |
71 |
41% |
|
From Community |
71 |
41% |
|
HCP |
31 |
18% |
|
Total |
173 |
100.0 |
.png)
Figure 1. Frequency distribution of the type of participants (n = 173).
Table 2 shows the demographic features of the women. We found that most of the women her ages were in the age group of (21-40) years, while the least are women who had an age less than 20 years. Regarding the educational level of the women, we found that most of the women had a university educational level, while one woman was illiterate. Regarding occupation, we found that most women were not employed. Regarding socioeconomic status, we found that around two-third of the women had moderate socioeconomic status, while the least one had high socioeconomic status. Regarding parity, we found that nearly two-third of women were multiparty, while the remainder had para one. Regarding the nationality of the women, we found that eighty percent of the women were Saudi.
Table 2. Frequency distribution of demographic features of the women (no. 142).
|
Type of participant |
Percent |
||||
|
From Hospital |
From Community |
Total |
|||
|
Age group |
2 1-40 yrs. |
35 |
62 |
97 |
68.3 |
|
4 1-60 yrs. |
19 |
6 |
25 |
17.6 |
|
|
less than 20 yrs. |
17 |
3 |
20 |
14.1 |
|
|
More than 60 yrs. |
0 |
0 |
0 |
0.0 |
|
|
Highest Education level |
University |
17 |
43 |
60 |
42.3 |
|
Secondary School |
36 |
5 |
41 |
28.9 |
|
|
Higher School |
9 |
18 |
27 |
19.0 |
|
|
Primary school |
7 |
3 |
I0 |
7.0 |
|
|
Post graduate |
1 |
2 |
3 |
2.1 |
|
|
Literate |
1 |
0 |
1 |
0.7 |
|
|
Occupation |
Not employed |
39 |
44 |
83 |
58.5 |
|
Employed |
32 |
27 |
59 |
41.5 |
|
|
Socioeconomic Status |
High |
14 |
4 |
18 |
12.7 |
|
Moderate |
29 |
60 |
89 |
62.7 |
|
|
Low |
28 |
7 |
35 |
24.6 |
|
|
Parity |
Para 1 |
34 |
23 |
57 |
40.1 |
|
Multi parity |
37 |
48 |
85 |
59.9 |
|
|
Nationality |
Saudi |
62 |
65 |
127 |
89.4 |
|
Non-Saudi |
9 |
6 |
15 |
10.6 |
|
Table 3 shows the demographic features of the HCPs. We found that most of the HCPs their age lied in the age group (31-40 years). Regarding gender, we found that around two-third of the HCPs were female, while male HCPs constituted around one-third. Regarding the HCP category, we found that around two-third of the HCPs were GP Doctors, while consultants constituted around one-third of them. Regarding the educational level of the HCPs, we found that around one-third of the HCPs had an educational level of university. Regarding the nationality of the HCPs, we found that around sixty of the HCPs were Saudi one.
Table 3. Frequency distribution of HCP demographic features.
|
Demographic features |
Category |
Frequency |
Percent |
|
Age group |
51-60 |
2 |
6.5 |
|
41-50 |
8 |
25.8 |
|
|
31-40 |
12 |
38.7 |
|
|
21-30 |
9 |
29.0 |
|
|
Gender |
Female |
20 |
64.5 |
|
Male |
1 1 |
35.5 |
|
|
HOP category |
GP Doctor |
20 |
64.5 |
|
Consultant |
1 1 |
35.5 |
|
|
Highest Education level |
Others |
6 |
19.4 |
|
Board Fellowship |
9 |
29.0 |
|
|
Master |
5 |
16.1 |
|
|
Diploma |
1 |
3.2 |
|
|
University |
I0 |
32.3 |
|
|
Nationality |
Non-Saudi |
13 |
41.9 |
|
Saudi |
18 |
58.1 |
|
|
Total |
31 |
100.0 |
|
Table 4 shows the experience years of HCPs in provision of ANC. We found that nearly half of the HCPs of them had more than 10 years of experience in provision of ANC.
Table 4. Frequency distribution of the duration of providing antenatal services by HCP.
|
Experience years in provision of ANC |
Frequency |
Percent |
|
More than 10 |
14 |
45.2 |
|
06-10 |
8 |
25.8 |
|
01-5 |
5 |
16.1 |
|
Less than 1 year |
4 |
12.9 |
|
Total |
31 |
100.0 |
Table 5 and figure 2 shows the distribution of Number of children of the women according to the Type of participants. We found that more than one-third of the women had one child, while women had 10 or 12 children constituted the least one.
Table 5. Frequency distribution of number of children of the women according to the type of participants.
|
Type of participant |
Total |
Percent |
||
|
No. of children |
From Hospital |
From Community |
||
|
12 |
2 |
0 |
2 |
1.4 |
|
10 |
o |
0 |
2 |
1.4 |
|
9 |
3 |
1 |
4 |
2.8 |
|
8 |
1 |
1 |
2 |
1.4 |
|
6 |
2 |
6 |
8 |
5.6 |
|
5 |
I0 |
11 |
2 1 |
14.8 |
|
4 |
2 |
7 |
9 |
6.3 |
|
3 |
4 |
9 |
13 |
9.2 |
|
2 |
15 |
13 |
28 |
19.7 |
|
1 |
27 |
23 |
50 |
35.2 |
|
0 |
3 |
0 |
3 |
2.1 |
|
Total |
71 |
71 |
142 |
100.0 |
.png)
Figure 2. Frequency distribution of number of children of the women according to the type of participants.
Figure 3 shows frequency distribution of mode of delivery of the women. We found that more than two-third of the women had normal vaginal delivery, while one-third of them undergone C/S.
.png)
Figure 3. Frequency distribution of mode of delivery of the women according to type of participants.
Table 6 shows the frequency distribution of sources of support on BR of the women. We notice that nearly half of the women get the support to continue on BR from Baby's father.
Table 6. Frequency distribution of sources of support on BR of the women.
|
What are the sources of support on Breast feeding |
Type of participant |
Total |
Percent |
|
|
From Hospital |
From Community |
|||
|
Baby’s father |
23 |
39 |
62 |
43.7 |
|
Relatives |
21 |
12 |
33 |
23.2 |
|
Workplace |
13 |
4 |
1 7 |
12.0 |
|
Friends |
10 |
4 |
14 |
9.9 |
|
Baby’s father & Relatives |
2 |
3 |
5 |
3.5 |
|
Relatives &. Friends |
0 |
4 |
4 |
2.8 |
|
Baby’s father & Friends & Relatives |
0 |
2 |
2 |
1 .4 |
|
None |
2 |
0 |
2 |
1 .4 |
|
Baby’s father & Workplace |
0 |
2 |
2 |
1 .4 |
|
Total |
71 |
7 1 |
142 |
100.0 |
Knowledge of breastfeeding: Table 7 shows the frequency distribution of women receiving counselling and the frequency distribution of HCPs who gave counseling on BR. We found that more than three-quarters of the women and HCPs received and gave counseling about BR, while just less than one-quarter of them did not receive or give counseling.
Table 7. Frequency distribution of women receiving (or giving) counseling on BR according to type of participants.
|
Do you hear about exclusive breastfeeding? |
Type of participant |
Percent |
Percent |
||
|
From Hospital |
From Community |
HCP |
|||
|
Yes |
54 |
46 |
31 |
131 |
75.7 |
|
No |
17 |
25 |
0 |
42 |
24.3 |
|
Total |
71 |
71 |
31 |
173 |
100.0 |
Table 8 shows the frequency distribution of food given to a baby immediately according to the type of participants. We found that more than three-quarters of the participants give breast milk to the child, while just one tenth of them give breast milk with others.
Table 8. Frequency distribution of food given to a baby immediately according to the type of participants.
|
Food given to a baby |
Type of participant |
Total |
Percent |
||
|
Hospital |
Community |
HCP |
|||
|
Breast Milk |
27 |
63 |
31 |
131 |
75.7 |
|
Formula Milk |
22 |
1 |
0 |
23 |
13.3 |
|
Cow's Milk |
3 |
0 |
0 |
3 |
1.7 |
|
Sugar-salt Solution |
4 |
1 |
0 |
5 |
2.9 |
|
Plain boiled water |
2 |
0 |
0 |
2 |
1.2 |
|
Salt solution |
1 |
0 |
0 |
1 |
0.6 |
|
Breast Milk & Plain boiled water |
0 |
2 |
0 |
2 |
1.2 |
|
Breast Milk & Formula Milk |
1 1 |
3 |
0 |
14 |
8.1 |
|
Breast Milk & Glucose |
1 |
1 |
0 |
2 |
1.2 |
|
Total |
71 |
71 |
31 |
173 |
100 |
Table 9 shows the frequency distribution of the duration of exclusive breastfeeding according to the type of participants. We noticed that more than half of the participants mentioned that the duration of exclusive breastfeeding is more than 10 months, while just quarter of them mentioned the duration of exclusive breastfeeding is 6 months.
Table 9. Frequency distribution of the duration of exclusive breastfeeding according to the type of participants.
|
Duration of exclusive breast feeding |
Type of participant |
Total |
Percent |
||
|
From Hospital |
From Community |
HCP |
|||
|
More than 10 Months |
54 |
29 |
8 |
91 |
52.6 |
|
6 |
0 |
21 |
43 |
24.9 |
|
|
10 |
1 |
8 |
0 |
9 |
5.2 |
|
5 |
5 |
2 |
0 |
7 |
4.0 |
|
7 |
5 |
1 |
0 |
6 |
3.5 |
|
2 |
1 |
3 |
1 |
5 |
2.9 |
|
0 |
4 |
0 |
0 |
4 |
2.3 |
|
3 |
1 |
3 |
0 |
4 |
2.3 |
|
8 |
0 |
3 |
0 |
3 |
1.7 |
|
4 |
0 |
1 |
0 |
1 |
0.6 |
|
Total |
71 |
71 |
3 1 |
1 73 |
100.0 |
Table 10 and figure 4 shows the frequency distribution of sources of knowledge gained by HCP regarding BR. We found that more than forty percent of the HCPs gained their knowledge regarding BR from the workshops and training, while personal reading constituted one-fifth of them.
Table 10. Frequency distribution of sources of knowledge gained by HCP regarding BR.
|
Source of Knowledge |
Frequency |
Percent |
|
Workshops & training |
13 |
41.9 |
|
Medical schools |
10 |
32.3 |
|
Personal reading |
6 |
19.4 |
|
Others |
2 |
6.5 |
|
Total |
31 |
100.0 |
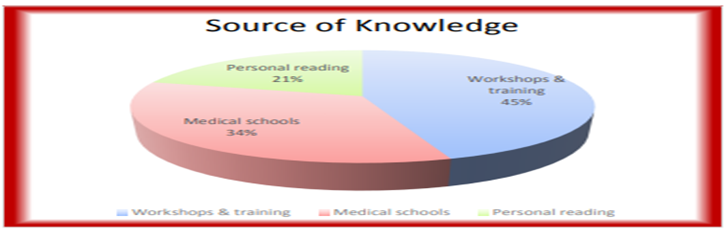
Figure 4. Frequency distribution of sources of knowledge gained by HCP regarding BR according to the Type of participants.
Table 11 shows the frequency distribution of sources of knowledge about BR gained by women. We noticed that quarter of the women get their knowledge from a family member, while just one woman gets her knowledge from Family and Friends.
Table 11. Frequency distribution of sources of knowledge of women.
|
From which of the following did you obtain your knowledge about breastfeeding? |
Type of participant |
Total |
Percent |
|
|
From Hospital |
From Community |
|||
|
Family Member |
15 |
21 |
36 |
25.4 |
|
PHC |
24 |
5 |
29 |
20.4 |
|
Hospital |
4 |
16 |
20 |
14.1 |
|
Social Media |
10 |
4 |
14 |
9.9 |
|
Friends |
8 |
1 |
9 |
6.3 |
|
Internet |
2 |
5 |
7 |
4.9 |
|
None |
5 |
1 |
6 |
4.2 |
|
Hospital & Social Media & Internet |
0 |
5 |
5 |
3.5 |
|
Social Media & Family |
I |
3 |
4 |
2.8 |
|
Hospital & Social Media & Friends |
0 |
3 |
3 |
2.1 |
|
Friends & PHC |
I |
I |
2 |
1.4 |
|
Social Media & Family & PHC |
0 |
2 |
2 |
1.4 |
|
Social Media & Family & Internet & Friends |
0 |
2 |
2 |
1.4 |
|
Hospital & Family |
0 |
2 |
2 |
1.4 |
|
Family & Friends |
1 |
0 |
1 |
0.7 |
|
Total |
71 |
71 |
142 |
100.0 |
Table 12 shows the frequency distribution of Benefits of Breastfeeding to children. In addition, it shows various degrees of good knowledge regarding the children’s benefits of BF.
Table 12. Frequency distribution of Benefits of Breastfeeding to children according to the Type of participants.
|
Benefits of BR to child |
Type of participant |
Total |
Percent |
|||
|
Hospital |
Community |
HCP |
||||
|
Has evolved to provide the best nutrition for the first 6 months |
Yes |
64 |
66 |
29 |
159 |
91.9 |
|
No |
3 |
0 |
1 |
4 |
2.3 |
|
|
I don't now |
4 |
5 |
1 |
10 |
5.8 |
|
|
It provides enough energy to the baby |
Yes |
60 |
66 |
31 |
157 |
90.8 |
|
No |
7 |
2 |
0 |
9 |
5.2 |
|
|
I don't now |
4 |
3 |
0 |
7 |
4.0 |
|
|
It prevents the baby from getting infections |
Yes |
57 |
67 |
30 |
154 |
89.0 |
|
No |
9 |
1 |
1 |
11 |
6.4 |
|
|
I don't now |
5 |
3 |
0 |
8 |
4.6 |
|
|
It provides baby with more protection from allergy |
Yes |
48 |
63 |
31 |
142 |
82.1 |
|
No |
16 |
2 |
0 |
18 |
10.4 |
|
|
I don't now |
7 |
6 |
0 |
13 |
7.5 |
|
|
Gives immune protection |
Yes |
46 |
67 |
31 |
144 |
83.2 |
|
No |
16 |
0 |
0 |
16 |
9.2 |
|
|
I don't now |
9 |
4 |
0 |
13 |
7.5 |
|
|
It regulates the growth |
Yes |
41 |
67 |
29 |
137 |
79.2 |
Table 13 shows frequency distribution of Benefits of Breastfeeding to mothers. In addition, it shows various degrees of good knowledge regarding maternal of the BR. Table 13: Frequency distribution of Benefits of Breastfeeding to mothers according to the Type of participants.
Table 13. Frequency distribution of Benefits of Breastfeeding to mothers according to the Type of participants.
|
Benefits of BR to Mother |
|
Type of participant |
Total |
Percent |
||
|
Hospital |
Community |
HCP |
||||
|
Enhancing involution of uterus |
Yes |
54 |
64 |
31 |
149 |
86.1 |
|
No |
9 |
1 |
0 |
10 |
5.8 |
|
|
I don't now |
8 |
6 |
0 |
14 |
8.1 |
|
|
Reduce maternal bleeding after delivery |
Yes |
52 |
50 |
30 |
132 |
76.3 |
|
No |
12 |
3 |
0 |
15 |
8.7 |
|
|
I don't now |
7 |
18 |
1 |
26 |
15.0 |
|
|
Facilitate positive metabolic changes |
Yes |
52 |
58 |
29 |
139 |
80.3 |
|
No |
10 |
1 |
0 |
11 |
6.4 |
|
|
I don't now |
9 |
12 |
2 |
23 |
13.3 |
|
|
Facilitate postpartum weight loss |
Yes |
52 |
56 |
28 |
136 |
78.6 |
|
No |
12 |
5 |
0 |
17 |
9.8 |
|
|
I don't now |
7 |
10 |
0 |
17 |
9.8 |
|
|
Reduce stress |
Yes |
52 |
49 |
27 |
128 |
74.0 |
|
No |
11 |
8 |
1 |
20 |
11.6 |
|
|
I don't now |
8 |
14 |
3 |
25 |
14.5 |
|
|
Delay ovulation and |
Yes |
54 |
54 |
31 |
139 |
80.3 |
|
Enhancing involution of uterus improve scoping |
Yes |
54 |
64 |
31 |
149 |
86.1 |
|
No |
9 |
1 |
0 |
10 |
5.8 |
|
|
I don't now |
8 |
6 |
0 |
14 |
61 |
|
|
No |
11 |
5 |
0 |
16 |
9.2 |
|
|
I don't now |
6 |
12 |
0 |
18 |
10.4 |
|
|
Reduce type 2 diabetes risk |
Yes |
50 |
45 |
18 |
113 |
65.3 |
|
No |
13 |
3 |
3 |
19 |
11.0 |
|
|
I don't now |
8 |
23 |
10 |
41 |
23.7 |
|
|
Reduce cardiovascular risk |
Yes |
45 |
61 |
16 |
122 |
70.5 |
|
No |
5 |
0 |
5 |
10 |
5.1 |
|
|
I don't now |
21 |
10 |
10 |
41 |
23.7 |
|
|
Can prevent breast cancer |
Yes |
45 |
61 |
26 |
132 |
76.3 |
|
No |
5 |
0 |
1 |
6 |
3.5 |
|
|
I don't now |
21 |
10 |
4 |
35 |
20.2 |
|
|
Reduce ovarian cancer ride |
Yes |
45 |
47 |
26 |
118 |
68.2 |
|
No |
8 |
0 |
2 |
10 |
5.8 |
|
|
I don't now |
18 |
24 |
3 |
45 |
26.0 |
|
|
It is easy, cheap and comfortable |
Yes |
44 |
65 |
31 |
140 |
80.9 |
|
No |
9 |
3 |
0 |
12 |
69 |
|
|
I don't now |
18 |
3 |
0 |
21 |
111 |
|
Table 14 and figure 5 shows the frequency distribution of the total knowledge according to the type of participants. Generally, we found the knowledge about BR was good and reach more than forty percent of them, while the poor knowledge occurred in one-third of them and mainly from the women in the hospital group and not from the HCPs.
Table 14. Frequency distribution of the total knowledge according to the type of participants.
|
Total knowledge |
Type of participant |
Total |
||
|
From Hospital |
From Community |
HCP |
||
|
Good Knowledge |
0(0%) |
44(25.4%) |
26(15%) |
70(40.5%) |
|
Moderate Knowledge |
2 (15.6%) |
13(7.5%) |
5(2.9%) |
45(26%) |
|
Poor Knowledge |
44(25.4%) |
14(8.1%) |
0(0%) |
58 (33.5%) |
|
Total |
71(41%) |
71(41%) |
31(18%) |
173(100%) |
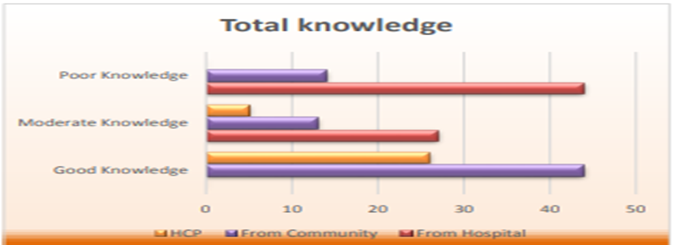
Figure 5. Frequency distribution of the total knowledge according to the type of participants.
Table 15 shows the different types of training in BR counseling received by HCP. We noticed that more than half of the HCPs received training in the Practical aspects of breastfeeding.
Table 15. Types of training in breastfeeding counseling received by HCP.
|
Type of the training |
Frequency |
Percent |
|
Practical aspects of breast feeding |
16 |
51.6 |
|
Problems with breastfeeding; |
1 |
3.2 |
|
Breast milk expression |
2 |
6.5 |
|
Duration of feeding |
2 |
6.5 |
|
Advantages to mother |
1 |
3.2 |
|
Advantages to baby |
3 |
9.7 |
|
Effective feeding |
6 |
19.4 |
|
Total |
31 |
100.0 |
Table 16 shows the different counseling of BR received by the women. We found most of the women received Counsel on the Importance of colostrum, Counsel on Initiation of breastfeeding, Counsel on Duration of feeding, Counsel on Advantages to the baby, and Counsel on Advantages to the mother (above eighty percent of them), while the least one was on the Counsel on Breastfeeding problems.
Table 16. Counseling of breastfeeding received by the women.
|
Counselling |
Hospital |
Community |
Total |
Percent |
|
|
Counsel on exclusive breastfeeding |
Yes |
58 |
38 |
96 |
67.6 |
|
No |
13 |
33 |
46 |
32.4 |
|
|
Counsel on Importance of colostrum |
Yes |
56 |
63 |
119 |
83.8 |
|
No |
15 |
8 |
23 |
16.2 |
|
|
Counsel on Initiation of breastfeeding |
Yes |
56 |
67 |
119 |
83.8 |
|
No |
15 |
4 |
23 |
16.2 |
|
|
Counsel on Duration of feeding |
Yes |
54 |
63 |
117 |
82.4 |
|
No |
17 |
8 |
25 |
17.6 |
|
|
Counsel on Practical aspects of breastfeeding |
Yes |
53 |
57 |
no |
77.5 |
|
No |
18 |
14 |
32 |
22.5 |
|
|
Counsel on Effective feeding |
Yes |
54 |
59 |
113 |
79.6 |
|
No |
17 |
12 |
29 |
20.4 |
|
|
Counsel on Advantages to the baby |
Yes |
53 |
64 |
117 |
82.4 |
|
No |
18 |
7 |
25 |
17.6 |
|
|
Counsel on Advantages to the mother |
Yes |
54 |
64 |
118 |
83.1 |
|
No |
17 |
7 |
24 |
16.9 |
|
|
Counsel on Breastfeeding problems |
Yes |
47 |
44 |
91 |
64.1 |
|
No |
24 |
27 |
51 |
35.9 |
|
|
Counsel on Expression of breast milk |
Yes |
51 |
49 |
100 |
70.4 |
|
No |
20 |
22 |
42 |
29.6 |
|
|
Counsel on Expression of Complementary feeding |
Yes |
50 |
50 |
100 |
70.4 |
|
No |
21 |
21 |
42 |
29.6 |
Attitude: Figure 7 shows the attitude of the women regarding the effectiveness of counselling in encouraging women to BR. Generally, we found that there was a positive attitude towards BR counseling of the mother.
Table 17 shows the frequency distribution of attitude according to the type of participants. We found that there was a positive attitude towards BR with various degrees except, for Store expressed breast milk for their baby when they are not available, and Women fed premature babies with breast feeding which accounted.
Table 17. Frequency distribution of Attitude according to the type of participants.
|
Attitude |
Type of participants |
Total |
Percent |
|||
|
Hospital |
Community |
HCP |
||||
|
Breastfeeding is old fashioned |
Disagree |
I0 |
63 |
29 |
102 |
59.0 |
|
Agree |
61 |
8 |
2 |
71 |
41.0 |
|
|
Store expressed breast milk for their baby when they are not available |
Disagree |
15 |
25 |
3 |
43 |
24.9 |
|
Agree |
56 |
46 |
28 |
130 |
75.1 |
|
|
Women fed premature babies with breast feeding |
Disagree |
14 |
13 |
2 |
29 |
16.8 |
|
Agree |
57 |
58 |
29 |
144 |
83.2 |
|
|
Women should breast fed during pregnancy |
Disagree |
18 |
53 |
17 |
88 |
50.9 |
|
Agree |
53 |
18 |
14 |
85 |
49.1 |
|
|
Breastfeeding is restrictive |
Disagree |
18 |
45 |
26 |
89 |
51.4 |
|
Agree |
53 |
26 |
5 |
84 |
48.6 |
|
|
Breastfeeding is uncomfortable |
Disagree |
19 |
60 |
28 |
107 |
61.8 |
|
Agree |
52 |
11 |
3 |
66 |
38.2 |
|
|
Exclusive breastfeeding is not important |
Disagree |
24 |
62 |
29 |
1 15 |
66.5 |
|
Agree |
47 |
9 |
2 |
58 |
33.5 |
|
|
1 perceive that breastfeeding is embarrassing |
Disagree |
21 |
53 |
24 |
98 |
56.6 |
|
Agree |
50 |
18 |
7 |
75 |
43.4 |
|
|
Infant formula-feeding is more convenient than breastfeeding |
Disagree |
23 |
63 |
29 |
1 15 |
66.5 |
|
Agree |
48 |
8 |
2 |
58 |
33.5 |
|
|
Breastfeeding decreases mother-infant bonding |
Disagree |
24 |
65 |
26 |
1 15 |
66.5 |
|
Agree |
47 |
6 |
5 |
58 |
33.5 |
|
|
It is less stressful to feed baby with infant formula than to breastfeed |
Disagree |
19 |
55 |
23 |
97 |
56.1 |
|
Agree |
52 |
16 |
8 |
76 |
43.9 |
|
Table 18 shows the frequency distribution of duration of breast milk alone as perceived by the type of participants. We found that half of the participants think that giving just Breast milk during the first 6 months, while just one woman extends the period of exclusive BR up to one year.
Table 18. Frequency distribution of duration of breast milk alone as perceived by the type of participants.
|
How long do you think breast milk alone without even water is sufficient for the baby |
Type of participant |
Total |
Percent |
||
|
From Hospital |
From Community |
||||
|
Six months |
0 |
54 |
25 |
88 |
50.9 |
|
>1 week |
30 |
2 |
0 |
32 |
18.5 |
|
1-2 weeks |
24 |
4 |
1 |
29 |
16.8 |
|
1-3 rraorat Fas |
3 |
9 |
5 |
17 |
9.8 |
|
2 years |
1 |
1 |
0 |
2 |
1.2 |
|
.00 |
4 |
0 |
0 |
4 |
2.3 |
|
1 year |
0 |
1 |
0 |
1 |
0.6 |
|
Total |
71 |
71 |
31 |
173 |
100.0 |
Table 19 shows the frequency distribution of continuation of breast milk according to specific circumstances as perceived by participants. We found that there was a positive attitude towards continuing BR with various degrees except, for continuing BF during mothers on medication and HIV infected.
Table 19. Frequency distribution of continuation of breast milk according to specific circumstances as perceived by participants.
|
Circumstances |
Type of participant |
Total |
Percent |
|||
|
Hospital |
Community |
HCP |
||||
|
Should breastfeeding continue |
Yes |
50 |
11 |
17 |
78 |
45.1 |
|
during pregnancy |
No |
16 |
51 |
6 |
73 |
42.2 |
|
I don't now |
5 |
9 |
5 |
19 |
11.0 |
|
|
Should breastfeeding continue during Maternal sickness |
Yes |
44 |
18 |
19 |
81 |
46.8 |
|
No |
23 |
41 |
10 |
74 |
42.8 |
|
|
I don't now |
4 |
12 |
2 |
18 |
10.4 |
|
|
Should breastfeeding continue |
Yes |
49 |
47 |
29 |
125 |
72.3 |
|
during Child sickness |
No |
17 |
13 |
2 |
32 |
18.5 |
|
I don't now |
5 |
11 |
0 |
16 |
9.2 |
|
|
Should breastfeeding continue |
Yes |
33 |
54 |
1 |
88 |
50.9 |
|
during Menstruation |
No |
28 |
9 |
2 |
39 |
22.5 |
|
I don't now |
10 |
8 |
28 |
46 |
26.6 |
|
|
Should breastfeeding continue during Mother on medication |
Yes |
25 |
16 |
18 |
59 |
34.1 |
|
No |
40 |
39 |
7 |
86 |
49.7 |
|
|
I don't now |
6 |
16 |
6 |
28 |
16.2 |
|
|
Should breastfeeding continue |
Yes |
25 |
12 |
4 |
41 |
23.7 |
|
during HIV infected |
No |
40 |
41 |
24 |
105 |
60.7 |
|
I don't now |
6 |
18 |
3 |
27 |
15.6 |
|
Table 20 and figure 6 shows the frequency distribution of total attitude towards BR according to the type of participants. Generally, there was a negative attitude towards BR in more than half of them (mainly from women from the community), while the positive attitude came mainly from women in the hospital.
Table 20. Frequency distribution of Total Attitude according to the type of participants.
|
Total Attitude |
Type of participant |
Total |
||
|
From Hospital |
From Community |
HCP |
||
|
Positive Attitude |
37(21.4%) |
19(11%) |
29(16.8%) |
85(49.1%) |
|
Negative Attitude |
34(19.7%) |
52(30.1%) |
2(1.2%) |
88(50.9%) |
|
Total |
71(41%) |
71(41%) |
31(18%) |
173(100%) |
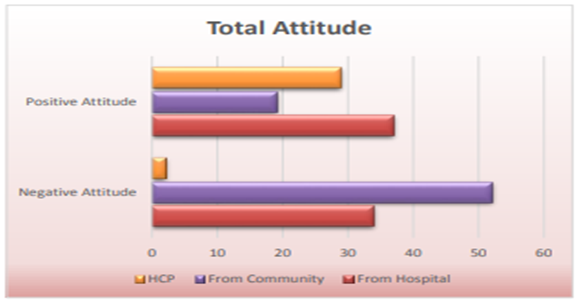
Figure 6. Frequency distribution of total attitude according to the type of participants.
Practice: Table 21 shows the frequency distribution of application of skin-to-skin according to the type of participants. We found more than three-quarters of the women applied skin-to-skin contact, while around one-fifth of them did not apply it.
Table 21. Frequency distribution of application of skin-to-skin according to the type of participants.
|
Application of skin-to-skin |
Type of participant community or hospital |
Total |
Percent |
|
|
Hospital |
Community |
|||
|
Yes |
53 |
58 |
1 1 1 |
78.2 |
|
No |
18 |
13 |
31 |
21.8 |
|
Total |
71 |
71 |
142 |
100.0 |
Table 22 and figure 7 shows the frequency distribution of the duration of exclusively breastfeeding according to the type of participants. We found that around one-third of the participants feed children up to 6 months.
Table 22. Frequency distribution of the duration of exclusively breastfeeding according to the type of participants.
|
Duration of EBR |
Type of participant |
Total |
Percent |
||
|
Hospital |
Community |
HCP |
|||
|
25 |
1 |
0 |
0 |
1 |
0.6 |
|
24 |
1 |
8 |
0 |
9 |
5.2 |
|
23 |
0 |
1 |
0 |
1 |
0.6 |
|
21 |
0 |
1 |
0 |
1 |
0.6 |
|
19 |
0 |
2 |
0 |
2 |
1.2 |
|
18 |
0 |
1 |
0 |
1 |
0.6 |
|
17 |
0 |
1 |
0 |
1 |
0.6 |
|
16 |
1 |
2 |
0 |
3 |
1.7 |
|
15 |
3 |
3 |
0 |
6 |
3.5 |
|
14 |
1 |
0 |
0 |
1 |
0.6 |
|
13 |
1 |
0 |
0 |
1 |
0.6 |
|
12 |
31 |
15 |
0 |
46 |
26.6 |
|
1 1 |
0 |
0 |
8 |
8 |
4.6 |
|
I0 |
3 |
6 |
0 |
9 |
5.2 |
|
9 |
1 |
1 |
0 |
2 |
1.2 |
|
8 |
0 |
2 |
0 |
2 |
1.2 |
|
7 |
3 |
1 |
0 |
4 |
2.3 |
|
6 |
11 |
24 |
18 |
53 |
30.6 |
|
5 |
6 |
0 |
1 |
7 |
4.0 |
|
4 |
1 |
0 |
1 |
2 |
1.2 |
|
2 |
0 |
1 |
1 |
2 |
1.2 |
|
1 |
0 |
2 |
1 |
3 |
1.7 |
|
0 |
7 |
0 |
1 |
8 |
4.6 |
|
Total |
71 |
71 |
31 |
173 |
100.0 |
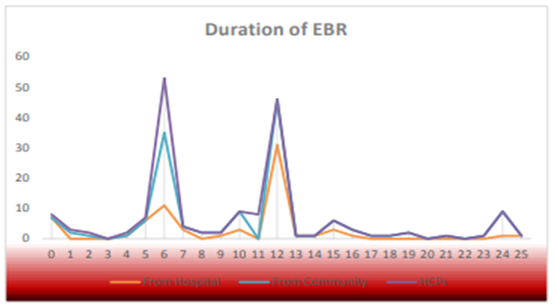
Figure 7. Frequency distribution of the duration of exclusively breastfeeding according to the type of participants.
Table 23 and figure 8 shows the frequency distribution of time of giving solid food according to the type of participants. We found that more than one-third of the participants start to feed their babies solid foods at age 6 months.
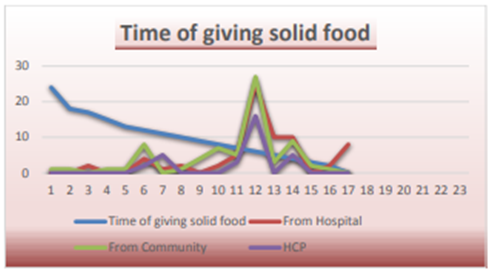
Figure 8. Distribution of time of giving solid food according to the type of participants.
Table 23. Frequency distribution of time of giving solid food according to the type of participants.
|
At what age do you feed your brain solid foods? |
Type of participants |
Total |
Percent |
||
|
Hospital |
Community |
HCP |
|||
|
24 |
0 |
1 |
0 |
1 |
0.6 |
|
18 |
0 |
1 |
0 |
1 |
0.6 |
|
17 |
2 |
0 |
0 |
2 |
12 |
|
15 |
0 |
1 |
0 |
1 |
0.6 |
|
13 |
0 |
1 |
0 |
1 |
0.6 |
|
12 |
4 |
8 |
2 |
14 |
8.1 |
|
11 |
1 |
0 |
5 |
6 |
3.5 |
|
10 |
2 |
1 |
0 |
3 |
1.7 |
|
9 |
0 |
4 |
0 |
4 |
2.3 |
|
8 |
2 |
7 |
0 |
9 |
52 |
|
7 |
5 |
5 |
3 |
13 |
7.5 |
|
6 |
25 |
27 |
16 |
68 |
39.3 |
|
5 |
10 |
3 |
0 |
13 |
7.5 |
|
4 |
10 |
9 |
5 |
24 |
13.9 |
|
3 |
0 |
2 |
0 |
2 |
12 |
|
2 |
2 |
1 |
0 |
3 |
1.7 |
|
0 |
8 |
0 |
0 |
8 |
4.6 |
|
Total |
71 |
71 |
31 |
173 |
100.0 |
Table 24 shows the frequency distribution of practices of BR according to the type of participants. Generally, there was a good practice of BR, except for the Poor position and attachment leading to insufficient milk production, and the length of time for each breastfeeding.
Table 24. Frequency distribution of practices of BR according to the type of participants.
|
Type of participants |
Total |
Percent |
||||
|
Hospital |
Community |
HCP |
||||
|
It is necessarily to feed from both breast each time |
Yes |
61 |
58 |
24 |
143 |
82.7 |
|
No |
5 |
10 |
6 |
21 |
12.1 |
|
|
I don't now |
5 |
3 |
1 |
9 |
5.2 |
|
|
It is important for mother to drink more fluids |
Yes |
51 |
68 |
31 |
150 |
86.7 |
|
No |
11 |
0 |
0 |
11 |
6.4 |
|
|
I don't now |
9 |
3 |
0 |
12 |
6.9 |
|
|
To present breast engorgement: frequent sucking, manual expression of the breast milk and apply hot water. |
Yes |
50 |
53 |
29 |
132 |
76.3 |
|
No |
10 |
3 |
1 |
14 |
8.1 |
|
|
I don't now |
11 |
15 |
1 |
27 |
15.6 |
|
|
Baby should feed on demand |
Yes |
40 |
59 |
22 |
121 |
69.9 |
|
No |
23 |
5 |
7 |
35 |
20.2 |
|
|
I don't now |
8 |
7 |
2 |
17 |
9.8 |
|
|
Baby should feed during illness |
Yes |
37 |
51 |
29 |
117 |
67.6 |
|
No |
19 |
5 |
0 |
24 |
13.9 |
|
|
I don't now |
15 |
15 |
2 |
32 |
18.5 |
|
|
Poor position and attachment lead to insufficient milk production |
Yes |
36 |
40 |
24 |
100 |
57.8 |
|
No |
23 |
6 |
5 |
34 |
19.7 |
|
|
I don't now |
12 |
25 |
2 |
39 |
22.5 |
|
|
The baby should be breastfed during the night. |
Yes |
37 |
55 |
27 |
119 |
68.8 |
|
No |
16 |
6 |
1 |
23 |
13.3 |
|
|
I don't now |
18 |
10 |
3 |
31 |
17.9 |
|
|
Skin to skin contact is important |
Yes |
34 |
48 |
31 |
113 |
65.3 |
|
No |
19 |
5 |
0 |
24 |
13.9 |
|
|
I don't now |
18 |
18 |
0 |
36 |
20.8 |
|
|
Number of times feed your baby (6-8 times) |
Yes |
42 |
52 |
25 |
119 |
68.8 |
|
No |
15 |
6 |
3 |
24 |
13.9 |
|
|
I don't now |
14 |
13 |
3 |
30 |
173 |
|
|
Length of time for each breastfeeding (Half an hour) |
Yes |
42 |
33 |
17 |
92 |
53.2 |
|
No |
14 |
16 |
4 |
34 |
19.7 |
|
|
I don't now |
15 |
22 |
10 |
47 |
27.2 |
|
Factors affecting noncompliance to breastfeeding, Table 25 shows that more than forty percent of the participants agree with Hospital admission of the mother as a factor affecting BR according to their perception.
Table 25. Hospital admission of the mother as a factor affecting BR according to their perception.
|
Hospital admission of the mother |
Type of participant |
Total |
Percent |
|||
|
From Hospital |
From Community |
HCP |
||||
|
Strongly disagree |
7 |
0 |
0 |
7 |
4.0 |
|
|
Disagree |
6 |
0 |
0 |
6 |
3.5 |
|
|
Neither agree nor disagree |
13 |
11 |
0 |
24 |
13.9 |
|
|
Agree |
40 |
8 |
24 |
72 |
41.6 |
|
|
Strongly agree |
5 |
52 |
7 |
64 |
37.0 |
|
|
Total |
71 |
71 |
31 |
173 |
100.0 |
|
Table 26 shows that more than one-third of the participants agreed with Hospital admission of the Baby as a factor affecting BR according to their participants.
Table 26. Hospital admission of the Baby as a factor affecting BR according to perception of the participants.
|
Hospital admission of the baby |
Type of participant |
Total |
Percent |
|||
|
Hospital |
Community |
HCP |
||||
|
Strongly disagree |
5 |
0 |
3 |
8 |
4.6 |
|
|
Disagree |
5 |
0 |
12 |
17 |
9.8 |
|
|
Neither agree nor disagree |
15 |
9 |
8 |
32 |
18.5 |
|
|
Agree |
41 |
22 |
6 |
69 |
39.9 |
|
|
Strongly agree |
5 |
40 |
2 |
47 |
27.2 |
|
|
Total |
71 |
71 |
31 |
173 |
100.0 |
|
Table 27 shows that more than one-third of the participants agree with insufficient milk supply is a factor affecting BR according to the perception of the participants.
Table 27. Insufficient milk supply is a factor affecting BR according to the perception of the participants.
|
Insufficient milk supply |
Type of participant |
Total |
Percent |
|||
|
From Hospital |
From Community |
HCP |
||||
|
Strongly disagree |
4 |
0 |
4 |
8 |
4.6 |
|
|
Disagree |
6 |
0 |
9 |
15 |
8.7 |
|
|
Neither agree nor disagree |
13 |
20 |
2 |
35 |
20.2 |
|
|
Agree |
42 |
15 |
11 |
68 |
39.3 |
|
|
Strongly agree |
6 |
36 |
5 |
47 |
27.2 |
|
|
Total |
71 |
71 |
31 |
173 |
100.0 |
|
Table 28 shows that more than one-third of the participants agree with maternal discomfort as a factor affecting BR according to the perception of the participants.
Table 28. Maternal discomfort as a factor affecting BR according to the perception of the participants.
|
Type of participant |
Total |
Percent |
||||
|
From Hospital |
From Community |
HCP |
||||
|
Maternal |
Strongly disagree |
4 |
0 |
5 |
9 |
5.2 |
|
discomfort |
Disagree |
6 |
0 |
9 |
15 |
8.7 |
|
Neither agree nor disagree |
15 |
1 7 |
4 |
36 |
20.8 |
|
|
Agree |
41 |
18 |
9 |
68 |
39.3 |
|
|
Strongly agree |
5 |
36 |
4 |
45 |
26.0 |
|
|
Total |
71 |
71 |
31 |
1 73 |
100.0 |
|
Table 29 shows that nearly half of the participants agreed with returning back to work is a factor affecting BR according to the perception of the participants.
Table 29. Returning back to work is a factor affecting BR according to the perception of the participants.
|
Returning back to work |
Type of participant |
Total |
Percent |
|||
|
From Hospital |
From Community |
HCP |
||||
|
Strongly disagree |
3 |
0 |
10 |
13 |
7.5 |
|
|
Disagree |
4 |
0 |
6 |
10 |
5.8 |
|
|
Neither agree nor disagree |
10 |
16 |
4 |
30 |
17.3 |
|
|
Agree |
43 |
32 |
7 |
82 |
47.4 |
|
|
Strongly agree |
11 |
23 |
4 |
38 |
22.0 |
|
|
Total |
71 |
71 |
31 |
173 |
100.0 |
|
Table 30 shows that more than one-third of the participants agree with inadequate maternal health education as a factor affecting BR according to the perception of the participants.
Table 30. Inadequate maternal health education as a factor affecting BR according to the perception of the participants.
|
Inadequate maternal health education |
Type of participant |
Total |
Percent |
|||
|
From Hospital |
From Community |
HOP |
||||
|
Strongly disagree |
1 |
0 |
9 |
10 |
5.8 |
|
|
Disagree |
5 |
0 |
10 |
15 |
8.7 |
|
|
Neither agree nor disagree |
12 |
14 |
8 |
34 |
19.7 |
|
|
Agree |
44 |
17 |
2 |
63 |
36.4 |
|
|
Strongly agree |
9 |
40 |
2 |
51 |
29.5 |
|
|
Total |
71 |
71 |
31 |
173 |
100.0 |
|
Table 31 shows that more than one-third of the participants were agree with Lack of continued support and follow up as a factor affecting BR according to perception of the participants.
Table 31. Lack of continued support and follow up as a factor affecting BR according to perception of the participants.
|
Lack of continued support and follow up |
Type of participant |
Total |
Percent |
|||
|
From Hospital |
From Community |
HCP |
||||
|
Strongly disagree |
3 |
0 |
11 |
14 |
8.1 |
|
|
Disagree |
4 |
0 |
16 |
20 |
1 1.6 |
|
|
Neither agree nor disagree |
14 |
16 |
2 |
32 |
18.5 |
|
|
Agree |
40 |
18 |
2 |
60 |
34.7 |
|
|
Strongly agree |
10 |
37 |
0 |
47 |
27.2 |
|
|
Total |
71 |
71 |
3 1 |
173 |
100.0 |
|
Table 32 shows that more than one-third of the participants strongly agree with Breast problems as a factor affecting BR according to the perception of the participants.
Table 32. Breast problems as a factor affecting BR according to the perception of the participants.
|
Breast problem |
Type of participant |
Total |
Percent |
|||
|
From Hospital |
From Community |
HCP |
||||
|
Strongly disagree |
5 |
0 |
10 |
15 |
8.7 |
|
|
Disagree |
4 |
0 |
14 |
18 |
10.4 |
|
|
Neither agree nor disagree |
9 |
8 |
3 |
20 |
11.6 |
|
|
Agree |
40 |
9 |
3 |
52 |
30.1 |
|
|
Strongly agree |
13 |
54 |
1 |
68 |
39.3 |
|
|
Total |
71 |
71 |
31 |
173 |
100.0 |
|
Table 33 shows that more than one-third of the participants strongly agreed with Breastfeeding were too tiring as a factor affecting BR according to the perception of the participants.
Table 33. Breastfeeding was too tiring as a factor affecting BR according to the perception of the participants.
|
Breastfeeding was too tiring |
Type of participant |
Total |
Percent |
|||
|
From Hospital |
From Community |
HCF |
||||
|
Strongly disagree |
2 |
0 |
5 |
7 |
4.0 |
|
|
Disagree |
6 |
0 |
10 |
16 |
9.2 |
|
|
Neither agree nor disagree |
8 |
16 |
5 |
29 |
16.8 |
|
|
Agree |
40 |
30 |
10 |
80 |
46.2 |
|
|
Strongly agree |
15 |
25 |
1 |
41 |
23.7 |
|
|
Total |
71 |
71 |
31 |
173 |
100.0 |
|
Table 34 shows that one-third of the participants were strongly agreed with Because of becoming pregnant as a factor affecting BR according to perception of the participants.
Table 34. Because of becoming pregnant as a factor affecting BR according to perception of the participants.
|
Because of becoming pregnant |
Type of participant |
Total |
Percent |
||
|
From Hospital |
From Community |
HCP |
|||
|
Strongly disagree |
4 |
0 |
3 |
7 |
4.0 |
|
Disagree |
4 |
0 |
17 |
21 |
12.1 |
|
Neither agree nor disagree |
9 |
14 |
7 |
30 |
17.3 |
|
Agree |
38 |
13 |
4 |
55 |
31.8 |
|
Strongly agree |
16 |
44 |
0 |
60 |
34.7 |
|
Total |
71 |
71 |
31 |
173 |
100.0 |
Table 35 shows that more than one-third of the participants agreed with a Baby refusing the breast are a factor affecting BR according to the perception of the participants.
Table 35. Baby refusing the breast as factor affecting BR according to the perception of the participants.
|
Baby refused the breast |
Type of participant |
Total |
Percent |
||
|
From Hospital |
From Community |
HCP |
|||
|
Strongly disagree |
6 |
0 |
3 |
9 |
5.2 |
|
Disagree |
5 |
0 |
11 |
16 |
9.2 |
|
Neither agree nor disagree |
9 |
21 |
6 |
36 |
20.8 |
|
Agree |
38 |
15 |
9 |
62 |
35.8 |
|
Strongly agree |
13 |
35 |
2 |
50 |
28.9 |
|
Total |
71 |
71 |
31 |
173 |
100.0 |
Table 36 shows the more than one-third of the participants were agreed with contraceptive pills reduced milk supply as a factor affecting BR according to perception of the participants.
Table 36. Contraceptive pills reduced milk supply as a factor affecting BR according to perception of the participants.
|
Contraceptive pills reduced milk supply |
Type of participant |
Total |
Percent |
||
|
From Hospital |
From Community |
HCP |
|||
|
Strongly disagree |
5 |
0 |
6 |
11 |
6.4 |
|
Disagree |
7 |
0 |
I 1 |
18 |
10.4 |
|
Neither agree nor disagree |
9 |
18 |
7 |
34 |
19.7 |
|
Agree |
38 |
13 |
6 |
57 |
32.9 |
|
Strongly agree |
12 |
40 |
1 |
53 |
30.6 |
|
Total |
71 |
71 |
31 |
173 |
100.0 |
Barriers: Table 37 shows that more than forty percent of the participants strongly agreed with Misconceptions regarding contraindications to breastfeeding as a barrier to BR according to perception of the participants.
Table 37. Misconceptions regarding contraindications to breastfeeding as a barrier to BR according to perception of the participants.
|
Misconceptions regarding contraindications to breastfeeding |
Type of participant |
Total |
Percent |
|
|
From Hospital |
From Community |
|||
|
Strongly disagree |
1 |
0 |
1 |
0.7 |
|
Disagree |
2 |
0 |
2 |
1.4 |
|
Neither agree nor disagree |
14 |
17 |
31 |
21.8 |
|
Agree |
39 |
10 |
49 |
34.5 |
|
Strongly agree |
15 |
44 |
59 |
41.5 |
|
Total |
71 |
71 |
142 |
100.0 |
Table 38 shows that more than forty percent of the participants were strongly agreed with Routine separation are necessary for treatment as a barrier to BR according to perception of the participants.
Table 38. Routine separation is necessary for treatment as a barrier to BR according to perception of the participants.
|
Routine separation is necessary for treatment |
Type of participant |
Total |
Percent |
|
|
From Hospital |
From Community |
|||
|
Strongly disagree |
0 |
0 |
0 |
0.0 |
|
Disagree |
3 |
0 |
3 |
2.1 |
|
Neither agree nor disagree |
16 |
19 |
35 |
24.6 |
|
Agree |
38 |
8 |
46 |
32.4 |
|
Strongly agree |
14 |
44 |
58 |
40.8 |
|
Total |
71 |
71 |
142 |
100.0 |
Table 39 shows that more than forty percent of the participants strongly agreed with the Severity of infant illness and prematurity are barriers to BR according to the perception of the participants.
Table 39. Severity of infant’s illness and prematurity as a barrier to BR according to the perception of the participants.
|
Severity of infant's illness and prematurity |
Type of participant |
Total |
Percent |
|
|
From Hospital |
From Community |
|||
|
Strongly disagree |
0 |
0 |
0 |
0.0 |
|
Disagree |
4 |
0 |
4 |
2.8 |
|
Neither agree nor disagree |
12 |
20 |
32 |
22.5 |
|
Agree |
37 |
8 |
45 |
31.7 |
|
Strongly agree |
18 |
43 |
61 |
43.0 |
|
Total |
71 |
71 |
142 |
100.0 |
Table 40 shows that more than one-third of the participants agreed with the Cultural expectation to use pacifiers to calm babies as a barrier to BR according to the perception of the participants.
Table 40. Cultural expectation to use pacifiers to calm babies as a barrier to BR according to the perception of the participants.
|
Cultural expectation to use pacifiers to calm babies |
Type of participant |
Total |
Percent |
|
|
From Hospital |
From Community |
|||
|
Strongly disagree |
0 |
0 |
0 |
0.0 |
|
Disagree |
3 |
0 |
3 |
2.1 |
|
Neither agree nor disagree |
18 |
12 |
30 |
21.1 |
|
Agree |
37 |
18 |
55 |
38.7 |
|
Strongly agree |
13 |
41 |
54 |
38.0 |
|
Total |
71 |
71 |
142 |
100.0 |
Table 41 shows that more than one-third of the participants were strongly agreed with early return back to work after birth as a barrier to BR according to perception of the participants.
Table 41. Early return back to work after birth as a barrier to BR according to perception of the participants.
|
Early return back to work after birth |
Type of participant |
Total |
Percent |
|
|
From Hospital |
From Community |
|||
|
Strongly disagree |
0 |
0 |
0 |
0.0 |
|
Disagree |
3 |
0 |
3 |
2.1 |
|
Neither agree nor disagree |
18 |
12 |
30 |
21.1 |
|
Agree |
37 |
18 |
55 |
38.7 |
|
Strongly agree |
13 |
41 |
54 |
38.0 |
|
Total |
71 |
71 |
142 |
100.0 |
Table 42 shows that more than forty percent of the participants strongly agreed with Lack of breastfeeding education is a barrier to BR according to the perception of participants.
Table 42. Lack of breastfeeding education is a barrier to BR according to the perception of participants.
|
Lack of breastfeeding education |
Type of participant |
Total |
Percent |
|
|
From Hospital |
From Community |
|||
|
Strongly disagree |
2 |
0 |
2 |
1.4 |
|
Disagree |
6 |
0 |
6 |
4.2 |
|
Neither agree nor disagree |
21 |
19 |
40 |
28.2 |
|
Agree |
28 |
7 |
35 |
24.6 |
|
Strongly agree |
14 |
45 |
59 |
41.5 |
|
Total |
71 |
71 |
142 |
100.0 |
Table 43 shows that more than one-third of the participants were strongly agreed with Low maternal confidence in breastfeeding as a barrier to BR according to perception of the participants.
Table 43. Low maternal confidence in breastfeeding as a barrier to BR according to perception of the participants.
|
Low maternal confidence in breastfeeding |
Type of participant |
Total |
Percent |
|
|
From Hospital |
From Community |
|||
|
Strongly disagree |
2 |
0 |
2 |
1.4 |
|
Disagree |
7 |
0 |
7 |
4.9 |
|
Neither agree nor disagree |
19 |
16 |
35 |
24.6 |
|
Agree |
30 |
12 |
42 |
29.6 |
|
Strongly agree |
13 |
43 |
56 |
39.4 |
|
Total |
71 |
71 |
142 |
100.0 |
Table 44 shows that more than forty percent of the participants strongly agreed with maternal anxiety & depression as a barrier to BR according to the perception of the participants.
Table 44. Maternal anxiety & depression as a barrier to BR according to the perception of the participants.
|
Maternal anxiety & depression |
Type of participant |
Total |
Percent |
|
|
From Hospital |
From Community |
|||
|
Strongly disagree |
4 |
0 |
4 |
2.8 |
|
Disagree |
9 |
0 |
9 |
6.3 |
|
Neither agree nor disagree |
15 |
20 |
35 |
24.6 |
|
Agree |
30 |
6 |
36 |
25.4 |
|
Strongly agree |
13 |
45 |
58 |
40.8 |
|
Total |
71 |
71 |
142 |
100.0 |
Table 45 shows that nearly forty percent of the participants strongly agreed with younger maternal age with no prior experience as a barrier to BR according to the perception of participants.
Table 45. Younger maternal age with no prior experience as a barrier to BR according to the perception of participants.
|
Younger maternal age with no prior experience |
Type of participant |
Total |
Percent |
|
|
From Hospital |
From Community |
|||
|
Strongly disagree |
7 |
0 |
7 |
4.9 |
|
Disagree |
6 |
0 |
6 |
4.2 |
|
Neither agree nor disagree |
15 |
13 |
28 |
19.7 |
|
Agree |
31 |
13 |
44 |
31.0 |
|
Strongly agree |
12 |
45 |
57 |
40.1 |
|
Total |
71 |
71 |
142 |
100.0 |
Table 46 shows the frequency distribution of barriers to BR according to the perception of the HCP. We found that there were various degrees of agreement with the possible barriers to BR according to the perception of the HCP.
Table 46. Frequency distribution of Barriers to BR according to the perception of the HCP.
|
Barriers |
Strongly agree |
Agree |
Neither agree nor disagree |
Disagree |
Strongly disagree |
Total |
|
|
Resistance to new policies and practices |
No. |
3 |
11 |
11 |
5 |
1 |
31 |
|
% |
9.7 |
35.5 |
35.5 |
16.1 |
3.2 |
100.0 |
|
|
Lack of support from key sectors |
No. |
6 |
16 |
5 |
4 |
0 |
31 |
|
% |
19.4 |
51.6 |
16.1 |
12.9 |
0.0 |
100.0 |
|
|
Lack of monitoring practice |
No. |
6 |
18 |
5 |
2 |
0 |
31 |
|
% |
19.4 |
58.1 |
16.1 |
6.5 |
0.0 |
100.0 |
|
|
Difficulties in training of staff |
No. |
6 |
8 |
8 |
8 |
1 |
31 |
|
% |
19.4 |
25.8 |
25.8 |
25.8 |
3.2 |
100.0 |
|
|
Limited attendance at education sessions |
No. |
6 |
17 |
3 |
4 |
1 |
31 |
|
% |
19.4 |
54.8 |
9.7 |
12.9 |
3.2 |
100.0 |
|
|
Routine practice of separation of baby |
No. |
8 |
15 |
4 |
3 |
1 |
31 |
|
% |
25.8 |
48.4 |
12.9 |
9.7 |
3.2 |
100.0 |
|
|
Culture of older nurses & midwifes |
No. |
4 |
11 |
7 |
7 |
2 |
31 |
|
% |
12.9 |
35.5 |
22.6 |
22.6 |
6.5 |
100.0 |
|
|
Limited staff time |
No. |
7 |
14 |
5 |
5 |
0 |
31 |
|
% |
22.6 |
45.2 |
16.1 |
16.1 |
0 |
100.0 |
Table 47 shows the frequency distribution of factors affecting BR according to the perception of the HCP. We found that Lack of continued support and follow-up was the most factors affecting BF.
Table 47. Frequency distribution of factors affecting BR according to the perception of the HCP.
|
Factors |
Sum |
Percent |
|
Lack of continued support and follow up |
129 |
10.4 |
|
Breast problem |
122 |
9.9 |
|
Inadequate maternal health education |
115 |
9.3 |
|
Because of becoming pregnant |
112 |
9.1 |
|
Contraceptive pills reduced milk supply |
108 |
8.7 |
|
Returning back to work |
104 |
8.4 |
|
Hospital admission of the baby |
101 |
8.2 |
|
Breastfeeding was too tiring |
101 |
8.2 |
|
Baby refused the breast |
97 |
7.9 |
|
Maternal discomfort |
95 |
7.7 |
|
Insufficient milk supply |
89 |
7.2 |
|
Hospital admission of the mother |
62 |
5.0 |
|
Total |
1235 |
100 |
Table 48 shows the frequency distribution Barriers affecting BR according to perception of the HCP. We found that Lack of monitoring practice keeping with policy was the most barriers affecting BR according to perception of the HCP.
Table 48. Frequency distribution Barriers affecting BR according to perception of the HCP.
|
Barriers |
Sum |
Percent |
|
Lack of monitoring practice keeping with policy |
121 |
13.5 |
|
Routine practice of separation of baby |
119 |
13.3 |
|
Lack of support from key sectors |
117 |
13.1 |
|
Limited attendance at education programs |
116 |
12.9 |
|
Limited staff time |
116 |
12.9 |
|
Resistance to new policies and practices |
103 |
11.5 |
|
Difficulties in training of staff |
103 |
11.5 |
|
Culture of older nurses and midwifes |
101 |
11.3 |
|
Total |
896 |
100.0 |
Table 49 shows the frequency distribution factors affecting BR according to the perception of the women. We found that Breast problem was the most factors affecting BR according to the perception of the women.
Table 49. Frequency distribution factors affecting BR according to the perception of the women.
|
Factors |
Sum |
Percent |
|
Breast problem |
300 |
8.9 |
|
Hospital admission of the baby |
294 |
8.8 |
|
Baby refused the breast |
291 |
8.7 |
|
Insufficient milk supply |
288 |
8.6 |
|
Contraceptive pills reduced milk supply |
288 |
8.6 |
|
Breastfeeding was too tiring |
283 |
8.4 |
|
Because of becoming pregnant |
283 |
8.4 |
|
Hospital admission of the mother |
267 |
8.0 |
|
Returning back to work |
267 |
8.0 |
|
Lack of continued support and follow up |
266 |
7.9 |
|
Maternal discomfort |
263 |
7.8 |
|
Inadequate maternal health education |
263 |
7.8 |
|
Total |
3353 |
100.0 |
Table 50 shows the frequency distribution barriers affecting BR according to the perception of the women. We found that the severity of infant illness and prematurity was the most barriers affecting BR according to the perception of the women.
Table 50. Frequency distribution barriers affecting BR according to the perception of the women.
|
Barriers |
Sum |
Percent |
|
Severity of infant illness and prematurity |
299 |
1 1.7 |
|
Cultural expectation to use pacifiers to calm babies |
299 |
1 1.7 |
|
Early return back to work after birth |
293 |
1 1.4 |
|
Routine separation is necessary for treatment |
288 |
1 1.2 |
|
Younger maternal age with no prior experience |
286 |
1 1.2 |
|
Misconceptions regarding contraindications to breastfeeding |
284 |
11.1 |
|
Low maternal confidence in breastfeeding |
284 |
11.1 |
|
Lack of breastfeeding education |
274 |
10.7 |
|
Maternal anxiety and depression |
257 |
10.0 |
|
Total |
2564 |
100.0 |
Table 51 shows the relation between the knowledge and attitude towards BR. We found that there is a significant association between the knowledge and the attitude of the participants towards BR (p value 0.034).
Table 51. The relation between the knowledge and attitude towards BR.
|
Total knowledge |
Total |
p-value |
||||
|
Total Attitude |
Poor Knowledge |
Moderate Knowledge |
Good Know ledge |
|||
|
Negative Attitude |
Count |
23 |
22 |
1 1 |
56 |
0.034 |
|
% of Total |
16.2% |
15.5% |
7.7% |
39.4% |
||
|
Positive Attitude |
Count |
35 |
18 |
33 |
86 |
|
|
% of Total |
24.6% |
12.7% |
23.2% |
60.6% |
||
|
Total |
Count |
58 |
40 |
44 |
142 |
|
|
% of Total |
40.8% |
28.2% |
31.0% |
100.0% |
||
DISCUSSION
In this study, we aimed to investigate the knowledge, attitude, and practice of breastfeeding and associated factors that affect compliance with the breeding among HCP and women in MCHM and Makkah community, KSA, 2019. We selected the participants according to the sample size equation for the women from the hospital and from the community of Makkah equally, and for the HCP participant, we selected all of the HCPs who were working at the hospital at the time of the collecting data. According to the demographic features of the participants, we found that most of the women her ages were in the age group of (21-40) years (relatively younger women), and most of them with university educational level which is a good sign a for learning the required instruction of the BR. Regarding the occupation, we found that most of the women were not employed, and this was also in favor of giving good chance to perform BR. Regarding sociometrist status, we found that most of the women had moderate socioeconomic status, and this is because of the country’s MIC ranking. Regarding the parity of the women, we found that most of the women were multiparty which indicates that there is good expert science with BR. Regarding the nationality of the women we found, that most of the women (89.4%) were Saudi ones as the one’s side in the origin country and the non-Saudi women mainly seek their medical care from private hospitals. On the other side, most of the HCPs having aged between aged-40 years) which means there are still young relatively and this, is because of the fact that the GP doctor constituted a large number of them. Regarding the gender of the HCPs were female and due to the nature of the hospital dealing with obstetrics cases. Regarding the educational level of the HCPs, most of them had an educational level of a university. Most of the HCPs were non-Saudi and this is because of the Saudization policies introduced in the system. We found that most of the HCPs had more than years of experience in the provision of ANC which is in 70 favor to give good chance to BR. Regarding the number of children of the women, most of the women had one child, which means they had a good experience dealing with BR. Regarding the mode of delivery of the women, most of the women had a normal vaginal delivery, and this also gives good chance to apply BR in comparison to S/C deliveries. Regarding the sources of support on BR of the women, we notice that most of the women get their support to continue on BR from Baby's father other people surround them and this also gives good chance to continue on BR. Regarding counseling on BR, most of the HCPs gave counseling on BR and most of the women who received counseling about this also gives a good chance to perform and continue on BR, and these findings were established by another study [35-37]. Regarding the food given to a baby immediately after delivery, most of the participants give breast milk to the child and this gives a good chance to EBR. However, most of the participants mentioned that the duration of exclusive breastfeeding is more than 10 months, but a quarter of them mentioned the duration of exclusive breastfeeding is 6 months. In addition, this in turn gives clues about the problem in the reliability of the information that they have about EBR. Regarding the sources of knowledge gained by HCP, most of them gained their knowledge about BR from the workshops and training and this gives a clue about the most feasible effective methods of training on BR. On the other hand, most of the women get their knowledge about BR family and friends which give chance to introduce wrong and untrusted information about BR and affect their attitudes and practices on BR. Regarding the Benefits of BR to the child and mother, we notice various degrees of good knowledge regarding the children and maternal benefits of BR. Generally, we found that the knowledge about BR was good, while the poor knowledge occurred mainly from the women in the hospital and not from the HCPs. Regarding receiving training in counseling of BR, most of the HCPs received training in counseling of BR mostly on the practical aspects of BR. On the other hand, 71 women received very good counseling on BR except for counsel on BR problems which was relatively low. Regarding the attitude towards BR, generally, there was a negative attitude towards BR (mainly from women from the community), while the positive attitude came mainly from women in the hospital and this may be due to the source of the knowledge gained by them, which is most properly untrusted. Again, most of the HCPs considered breastfeeding should not continue during HIV infection and this may be due to the fact that they did not update their knowledge about HIV and BR. Regarding the practices of BR, we found most of the women applied skin-to-skin and feed their children EBR and start to give solid food at age of 6 months. Generally, there was a good practice of BR, except for the Poor position and attachment lead to insufficient milk production and Length of time for each breastfeeding and this may be due to the fact that they received little counseling and training on these issues. Regarding the factors affecting BR, we found that most of the participants agreed that all mentioned factors affect BR. And these factors were: Hospital admission of the mother and Baby, insufficient milk supply, maternal discomfort, and returning back to work, inadequate maternal health education, Lack of continued support and follow-up, Breast problems, BR too tiring, women becoming pregnant, Baby refusing the breast and contraceptive pills reduced milk supply according to their perception and these findings match the other evidence [33,34]. Regarding the barriers to BR, we found that most of the women agreed that all mentioned barriers affected these barriers were: Misconceptions regarding contraindications to breastfeeding, Routine separations are necessary for treatment, Severity of infant t’s illness and prematurity, Cultural expectation to use pacifiers to calm babies, early return back to work after birth, Lack of breastfeeding education, Low maternal confidence in BR, maternal anxiety & depression, younger maternal age with no prior experience according to perception and this 72 findings match the other previous studies [43-45]. On the other hand, HCPs perceived that barriers to BR were various degrees of agreeing with the possible barriers to BR according to the perception of the HCP. Lack of continued support and follow-up, Lack of monitoring practice keeping with policy, and Breast problem as barriers to BR. Regarding the relation between the knowledge and attitude towards BR, we found that there was a significant association between the knowledge and the attitude of the participants towards BR, p-value 0.034 and this reflects the logical flow of knowledge to affect the attitude of the participants
Strengths of the study
This study will fill the gap in knowledge regarding the Knowledge, attitude, and practice of breastfeeding in KSA. It was conducted with a deep view to capture most of the factors affecting compliance with breastfeeding along with the barriers affecting breastfeeding from various perspectives. Limitations of the study: This study was conducted in a limited time with a relatively limited sample size not including many cities in KSA.
CONCLUSION
There is a good chance to train and learn the required knowledge and practices of BR among the women despite of the fact that they received full support to continue on BR and they are relatively younger and had high educational levels. Moreover, most of the women get their knowledge about BR from family and friends which give chance to introduce wrong and untrusted information about BR and affect their attitudes and practices on BR. Generally, the knowledge about BR was good, while the poor knowledge occurred mainly from the women in the hospital. However, the attitude towards BF was s generally negative attitude towards BR (mainly from women from the community). Moreover, most of the participants agreed with all factors and barriers affecting BR. and there was a significant association between the knowledge and the attitude of the participants towards BR [46].
RECOMMENDATIONS
According to our results, we recommend the followings: 1. Establish a national center for BR to deal with the training and practices of the BR around the country. 2. Ministry of Health should increase the training sessions for women and allocate resources to deal with the counseling of BR. 3. Misconceptions around BR should be resolved by the HCPs to increase the trusted information given to the women, correct the wrong knowledge, and increase positive attitude towards BR. 4. Breastfeeding Health education of women should be considered as a priority, and it should be performed by the HCPs in hospitals and PHCs [47].
REFERENCES
- World Health Organization. (1991). Division of Child Health and Development. Indicators for Assessing Breastfeeding Practice. Reprinted report of an informal meeting, June 11- 12, 1991. Geneva, Switzerland: WHO.
- World Health Organization/ United Nations Children’s Fund. (1993). Breastfeeding counseling: A training course. Participant’s guide. Division of diarrheal and acute respiratory disease control. Geneva, Switzerland: WHO.
- Khadivzadeh T, Persil S. (2004). Effect of (EBF) and complementary feeding on infant growth and morbidity. East Mediterr Health J. 10(3):289-294.
- Ortega-Garcia JA, Ferrís-Tortajada J, Torres-Cantero AM, Sold in OP, Torres EP, Fuster-Soler JL, et al. (2008). Full breastfeeding and pediatric cancer. J Paediatr Child Health. 44(1-2):10-13.
- Owen CG, Martin RM, Whincup PH, Davey-Smith G, Cook DG. (2006). Does breastfeeding influence risk of type 2 diabetes in later life? A quantitative analysis of published evidence. Am J Clin Nutr. 84(5):1043-1054.
- Kramer MS, Kakuma R. (2002). The optimal duration of exclusive breastfeeding. A systematic review. Geneva, Switzerland: Department of Child and Adolescent Health and Development.
- World Health Organization. (2001). Global Strategy for infant and young child feeding: The optimal duration of exclusive breastfeeding. Fifty World Health Assembly. Geneva, Switzerland: WHO.
- World Health Organization & United Nations Children’s Fund. (2003). Global strategy for infant and young child feeding. Geneva, Switzerland: WHO.
- Kramer MS, Chalmers B, Hodnett ED, Sevkovskaya Z, Dzikovich I, Shapiro S, et al. (2000). Promotion of Breastfeeding Intervention Trial (PROBIT): A cluster- randomized trial in the Republic of Belarus. In: Koletzko K, Michaelsen F, & Hernell O (Eds.). Short and Long Term Effects of Breast Feeding on Child Health. New York, USA: Kluwer 75 Academic/Plenum Publishers. pp. 327-345.
- United Nations Children’s Fund. Progress for children. (2006). A Report Card on Nutrition Number 4. New York, USA: UNICEF.
- Kramer MS, Chalmers B, Hodnett ED, Sevkovskaya Z, Dzikovich I, Shapiro S, et al. (2001). Promotion of Breastfeeding Intervention Trial (PROBIT): A randomized trial in the Republic of Belarus. JAMA. 285(4):413-420.
- Clemens J, Elyazeed RA, Rao M, Savarino S, Morsy BZ, Kim Y, et al. (1999). Early initiation of breastfeeding and risk of infant diarrhoea in rural Egypt. Pediatrics. 104(1):e3.
- Betrán AP, de Onís M, Lauer JA, Villar J. (2001). Ecological study of effect of breast feeding on infant mortality in Latin America. BMJ. 323(7308):303-306.
- Dewey KG, Cohen RJ, Brown KH, Rivera LL. (2001). Effects of (EBF) for four versus six months on maternal nutritional status and infant motor development: Results of two randomized trials in Honduras. J Nutr. 131(2):262-267.
- Horwood LJ, Darlow BA, Mogridge N. (2001). Breast milk feeding and cognitive ability at 7-8 years. Arch Dis Child Fetal Neonatal Ed. 84(1):F23-F27.
- Mortensen EL, Michaelsen KF, Sanders SA, Reinisch JM. (2002). The association between duration of breastfeeding and adult intelligence. JAMA. 287(18):2365-2371.
- Labbok MH. (2001). Effects of breastfeeding on the mother. Pediatr Clin North Am. 48(1):143-158.
- Muhuri PK, Menken J. (1997). Adverse effects of next birth, gender, and family composition on child survival in rural Bangladesh. Population Studies. 51(3):279-294.
- Tryggvadóttir L, Tulinius H, Eyfjord JE, Sigurvinsson T. (2001). Breastfeeding and reduced risk of breast cancer in an Icelandic cohort study. Am J Epidemiol. 154(1):37-42.
- Collaborative Group on Hormonal Factors in Breast Cancer. (2002). Breast cancer and breastfeeding: 76 Collaborative reanalysis of individual data for 47 epidemiological studies in 30 countries, including 50,302 women with breast cancer and 96,973 women without the disease. Lancet. 360(9328):187-195.
- Ness RB, Grisso JA, Cottreau C, Klapper J, Vergona R, Wheeler JE, et al. (2000). Factors related to inflammation of the ovarian epithelium and risk of ovarian cancer. Epidemiology. 11(2):111-117.
- Riman T, Dickman PW, Nilsson S, Correia N, Nordlinder H, Magnusson CM, et al. (2002). Risk factors for invasive epithelial ovarian cancer: results from a Swedish casecontrol study. Am J Epidemiol. 156(4):363-373.
- El Mouzan MI, Al Omar AA, Al Salloum AA, Al Herbish AS, Qurachi MM. (2009). Trends in infant nutrition in Saudi Arabia: compliance with WHO recommendations. Ann Saudi Med. 29(1):20-23.
- Ministry of Health in the Kingdom of Saudi Arabia: The health statistical year book. Riyadh, Saudi Arabia: MOH; 2010.
- World Health Organization: Saudi Arabia Country profile. Nutrition. 2010. Available At: http://apps.who.int/nutrition/landscape/report.aspx?iso=sau.
- Serenius F, Swailem AR, Edressee AW, Hofvander Y. (1988). Patterns of breastfeeding and weaning in Saudi-Arabia. Acta Paediatr Scand Suppl. 346:121-129.
- El-Gilany A, Shady E, Helal R. (2011). Exclusive breastfeeding (EBF) in Al-Hassa, Saudi Arabia. Breastfeed Med. 6(4):209-213.
- Amin T, Hablas H, Al Qader AA. (2011). Determinants of initiation and exclusivity of breastfeeding in Al Hassa, Saudi Arabia. Breastfeed Med. 6(2):59-68.
- Al-Hreashy FA, Tamim HM, Al-Baz N, Al-Kharji NH, Al-Amer A, Al-Ajmi H, et al. (2008). Patterns of breastfeeding practice during the first 6 months of life in Saudi Arabia. Saudi Med J. 29(8):1208-1210.
- Al-Jassir MS, El-Bashir BM, Moizuddin SK. (2004). Surveillance of infant feeding practices in Riyadh city. Ann Saudi Med. 24(2):136-140.
- Kordy MN, Ibrahim MA, El-Gamal FM, Bahnassy AA. (1992). Factors affecting the duration of breastfeeding in a rural population of Saudi Arabia. Asia Pac J Public Health. 6(1):35-39.
- Al-Othaimeen AI, Villanueva BP, Devol EB. (1987). The present trend in infant feeding practices in Saudi Arabia. Food Nutr Bull. 9(2):62-68.
- Shirima R, Gebre-Medhin M, Greiner T. (2001). Information and socio-economic factors associated with early breastfeeding practices in rural and urban Morogoro, Tanzania. ActaPediatrica. 90(8):936-942.
- Mabilia M. (2003). Beliefs and practices in infant feeding among the Wagogo of Chigongwe (Dodoma Rural District), Tanzania. Ecol Food Nutr. 35(3):195-207.
- Lumbiganon P, Martis R, Laopaiboon M, Festin MR, Ho JJ, Hakimi M. (2008). Antenatal breastfeeding education for increasing breastfeeding duration. Cochrane Database Syst Rev. 12(12):CD006425.
- Sikorski J, Renfrew MJ, Pindoria S, Wade A. (2003). Support for breastfeeding mothers: A systematic review. Paediatr Perinat Epidemiol. 17(4):407-417.
- Renfrew MJ. (2006). Time to get serious about educating health professionals. Matern Child Nutr. 2(4):193-195.
- Montalto SA, Borg H, Buttigieg-Said M, Clemmer E. (2010). Incorrect advice: The most significant negative determinant on breastfeeding in Malta. Midwifery. 26(1):e6-e13.
- Britton C, McCormick FM, Renfrew MJ, Wade A, King SE. (2007). Support for breastfeeding mothers. Cochrane Database Syst Rev.24(1):CD001141.
- Bernaix LW. (2001). Nurses’ attitudes, subjective norms, and behavioural intentions toward support of breastfeeding mothers. J Hum Lact. 16(3):201-209.
- Spear HJ. (2004). Nurses’ knowledge, attitudes, and behaviours related to the promotion of breastfeeding among women who bear children during adolescence. J Pediatr Nurs. 19(3):176-183.
- Freed GL, Clark SJ, Sorenson J, Lohr JA, Cefalo R, Curtis P. (1995). National assessment of physicians’ breastfeeding knowledge, attitudes, training, and experience. JAMA. 273(6):472-476.
- Brodribb W, Fallon AB, Hegney D, O'Brien M. (2007). Identifying predictors of the reasons women give for choosing to breastfeed. J Hum Lact. 23(4):338-344.
- Brodribb W, Jackson C, Fallon AB, Hegney D. (2007). Breastfeeding and the responsibilities of GPs: a qualitative study of general practice registrars. Aust Fam Physician. 36(4):283-285.
- Dillaway HE, Douma ME. (2004). Are pediatric offices "supportive" of breastfeeding? Discrepancies between mothers' and healthcare professionals' reports. Clin Pediatr (Phila). 43(5):417-430.
- Merriam-Webster, Inc Merriam-Webster's Geographical Dictionary. 2001; p. 724. ISBN 0-87779-546-0.
- KSA. “Statistics.” General Authority for Statistics, General Authority for Statistics, 2016. Available at: www.stats.gov.sa/sites/default/files/en-demographic-research-2016_2.pdf.