Information Links
Related Conferences
Previous Issues Volume 8, Issue 5 - 2023
Acute Pericarditis with Movable-Weaning Phenomenon (Yasser’s Phenomenon) and Variant T-Wave in Underlying Repolarization Pattern-Interpretation and Differentiation
Yasser Mohammed Hassanain Elsayed*
Critical Care Unit, Kafr-El-Bateeck Central Hospital, Damietta Health Affairs, Egyptian Ministry of Health (MOH), Damietta, Egypt
*Corresponding Author: Yasser Mohammed, Critical Care Unit, Kafr-El-Bateeck Central Hospital, Damietta Health Affairs, Egyptian Ministry of Health (MOH), Damietta, Egypt, Email: [email protected]
Received Date: March 23, 2023
Publication Date: April 18, 2023
Citation: Elsayed YMH, et al. (2023). Acute Pericarditis with Movable-Weaning Phenomenon (Yasser’s Phenomenon) and Variant T-Wave in Underlying Repolarization Pattern-Interpretation and Differentiation. Mathews J Case Rep. 8(5):105.
Copyright: Elsayed YMH, et al. © (2023)
ABSTRACT
Rationale: This case study aimed to clarify the association and interpretation of acute pericarditis with the Movable-weaning phenomenon (Yasser’s phenomenon) and variant T-wave in the underlying repolarization pattern. So, how would you manage this case? Acute pericarditis is a fatal cardiovascular disorder hallmarked by pericardial inflammation. Varieties of ECG signs can be revealed in acute pericarditis. Hypocalcemia is a renowned remarkable electrolyte imbalance associated with calcium deficiency. The Movable-weaning phenomenon or Yasser’s phenomenon is a novel electrocardiographic phenomenon in hypocalcemia. It is a guide for both Wavy triple or double electrocardiographic signs. Electrocardiographic Wavy triple sign (Yasser’s sign) of hypocalcemia is a new diagnostic sign reported in 97.3% of hypocalcemia. Differentiation of the benign form from the malignant one of early repolarization is a diagnostic keystone. Malignant early repolarization may be accompanied by idiopathic ventricular fibrillation and sudden cardiac death. An upright highest T-wave in V2 and 3 leads may be considered a normal variant in young. Patient concerns: This is a retrospective-observational case study. A young-aged worker heavy smoker married Egyptian male patient was admitted to the intensive care unit with acute severe chest pain and acute pericarditis. Diagnosis: Acute pericarditis with Movable-weaning phenomenon (Yasser’s phenomenon) and variant T-wave in underlying repolarization pattern. Interventions: Electrocardiography and echocardiography. Outcomes: Despite there are serious probable expected outcomes but piecemeal spectacular clinical and electrocardiographic improvements had happened. Lessons: Diversity of electrocardiographic signs of acute pericarditis with Movable-weaning phenomenon or Yasser’s phenomenon and repolarization pattern are newly described. An upright highest normal variant T-wave in V2 and 3 leads may be help in differential diagnosis. The presence of a repolarization pattern has a prognostic value in this case. Viral infection may be implicated in the current acute pericarditis.
Keywords: Pericardial diseases, New signs and phenomena in ECG, Hypocalcemia, Tetany, Electrical changes in ECG
ABBREVIATIONS
AMI: Acute myocardial infarction; CAS: Coronary artery spasm; CBC: Complete blood count; ECG: Electrocardiography; ICU: Intensive care unit; NSR: Normal sinus rhythm; O2: Oxygen; SGOT: Serum glutamic-oxaloacetic transaminase; GPT: Serum glutamic-pyruvic transaminase; STEMI: ST-segment elevation myocardial infarction; VR: Ventricular rate
INTRODUCTION
Acute pericarditis is the most common pericardial disease1. The etiological detection is often inconclusive. Viral or idiopathic causes are frequent. However, approximately 95% of acute pericarditis presents with retrosternal acute, sharp, pleuritic chest pain. The pain usually improves in a seated position or by inclination forward. It is not mitigated with nitrates. Indeed, acute pericarditis by itself has low mortality [1]. Extensive concave ST-segment elevation is often in most of the ECG leads (I, II, III, aVL, aVF, and V2-6) [2]. Spodick's sign is detected with pericarditis, but it is reported in 5% of patients with acute myocardial infarction (MI) [3]. Spodick’s sign is considered if at least two leads had TP-segment downsloping of at least 1 mm3. It is seen in ~30% of pericarditis in ECG leads II and the lateral precordial leads [4]. The perpendicular height of the ST-segment elevation is metric and matched to the voltage of the T-wave (ST-segment/T-wave ratio) in V6 lead. If the ratio is more than the fourth proposes acute pericarditis but if it is less than the fourth indicates benign early repolarization [3]. PR-segment depression is surely reported in viral pericarditis and no more. However, it is an early temporary sign (lasting only hours). Myocardial infarction may also cause PR-segment depression if there is an atrial infarction or associated PR-segment elevation in aVR [2]. ST-segment elevation in lead II more than III lead was a distinct sign [2]. Nonsteroidal anti-inflammatory drugs (NSAIDs) should be used as an initial treatment [1]. The presence of achangeable Wavy triple electrocardiographic sign in ECG leads is a hallmark for the existence of the Movable phenomenon or Yasser’s phenomenon of hypocalcemia [5]. Increased breathing is a common cause of hypocalcemia and sequential Wavy triple ECG sign and relevant Movable-weaning phenomenon of hypocalcemia [6]. The Wavy triple ECG sign (Yasser’s sign) is an innovative contemporary diagnostic sign in hypocalcemia. Related wavy double an electrocardiographic sign also was prescribed in hypocalcemia which is mostly seen with either tachycardia or bradycardia [7,8]. The sign analysis for the author's opinion is relied on; 1. Diverse consecutive three ECG beats in the same lead are influenced. 2. All ECG leads can be implicated. 3. An associated elevated beat is seen with the first of the successive three beats, a depressing beat with the second beat, and isoelectric ST-segment in the third one. 4. The elevated beat is either associated with ST-segment elevation or even beat elevation above the isoelectric line. 5. The depressed beat is either with ST-segment depression or a depressed ECG beat below the isoelectric line. 6. This arrangement of depressions, elevations, and iso electricities of STsegment for the sequent three beats is usually variable from case to case. Thus, it is non-conditional. 7. Generally, there is no sharing among the affected leads. The non-conditional status is meaning that, there is no correlation between any special coronary artery to the involved leads [7]. Differentiation of the benign form from the malignant one of early repolarization is a diagnostic keystone [8]. Malignant early repolarization may be accompanied by idiopathic ventricular fibrillation and sudden cardiac death [9]. Highest amplitude of T wave at V2 and V3 lead may be considered a normal variant in young [10].
CASE PRESENTATION
A 34-year-old worker heavy-smoker married Egyptian male patient presented to the intensive care unit (ICU) with acute severe chest pain and tachypnea for about 12 hours. Chest pain was stabbing, sharp, retrosternal, pericardial, referring to left shoulder, ameliorated in sitting position; aggravated in supine position and inspiration. Numbness and paresthesia of extremities were associated symptoms. Upon general physical examination; generally, the patient was anxious and distressed, with a regular pulse rate of VR of 80, blood pressure (BP) of 140/90 mmHg, respiratory rate of 22 bpm, a temperature of 38 °C, and pulse oximeter of oxygen (O2) saturation of 98%. He seemed thin body status. Friction rub was listening on cardiac auscultation. Tests for latent tetany were positive. There were no more clinical findings were reported on the clinical examination. The patient was admitted to the ICU with acute pericarditis. Initially, he was given O2 inhalation (100%, nasal cannula, 3L/min). Diclofenac sodium amp (75mg, BID) and colchicine tablets (500ug, BID) were maintained and added to therapy. The initial complete blood count (CBC); Hb was 13.7 g/dl, RBCs; 4.73*103/mm3, WBCs; 6.0*103/mm3, and Platelets; 139*103/mm3. HCT was 40.2%. CRP was negative (less than 6 g/dl). SGPT (14U/L) and SGOT (16U/L) were normal. Serum creatinine was normal (1mg/dl). RBS was normal (88 mg/dl). Plasma sodium (141mmol/L) and serum potassium (4.4mmol/L) were normal. Ionized calcium was low (0.82mmol/L). ABG showed acute respiratory alkalosis. The initial and serial troponin I test was negative (0.1ng/dl). Serial ECG tracings were done. The initial ECG was done on the initial presentation showing normal sinus rhythm (NSR; VR; 81) with widespread concave upward ST-segment elevation, downsloping TP-segment (Spodick sign), ST-segment depression in aVR lead, PR-segment elevation in aVR lead, PR-segment depression in other leads, and the amplitude of ST-segment elevation (in mm) in lead II lead more than III lead. There is evidence of a Wavy triple electrocardiographic sign (Yasser’s sign) of hypocalcemia in V4-6 leads, malignant repolarization pattern in II, and V4-6 leads (pink arrows), and normal variant T-wave in V2 (Figure 1A). The second ECG tracing was done within 3 minutes of the above initial presentation showing NSR (VR; 84), the ratio of ST-segment elevation to T-wave amplitude (in mm) in lead V6 more than 0.25, with the same other changes but with the disappearance of the Wavy triple an electrocardiographic sign (Yasser’s sign) of hypocalcemia (Figure 1B). The third ECG tracing was done within 4 hours of the above initial presentation showing NSR (VR; 76) with the same initial changes but with the disappearance of the Wavy triple an electrocardiographic sign (Yasser’s sign) of hypocalcemia (Figure 2A). The fourth ECG tracing was done within 6 hours of the above initial presentation showing NSR (VR; 86) with slight diminution of the initial widespread concave upward ST-segment elevation (Figure 2B). The echocardiography was done 2 days after the presentation showing grade I diastolic dysfunction with normal EF (61%). Acute pericarditis with Movable-weaning phenomenon (Yasser’s phenomenon) and variant T-wave in underlying repolarization pattern was the most probable diagnosis. Within 48 hours of the above management, the patient finally showed nearly clinical and slight ECG improvement. The patient was discharged on the 2nd day and continued on diclofenac sodium tablets (25mg, TID) for two weeks and colchicine tablets (500ug, BID) for three months. Future cardiac follow-up was advised.
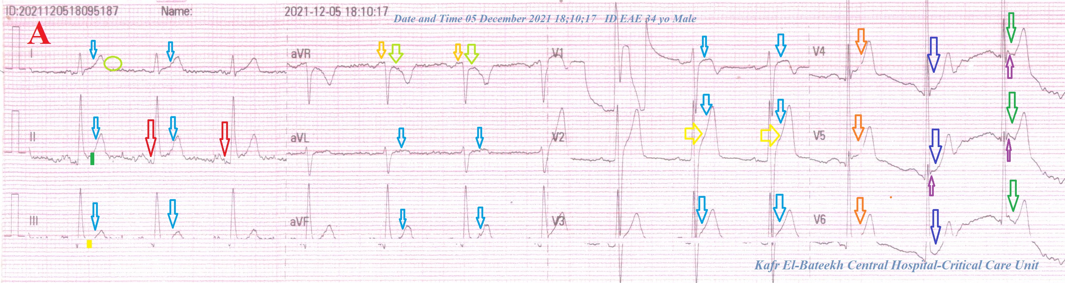
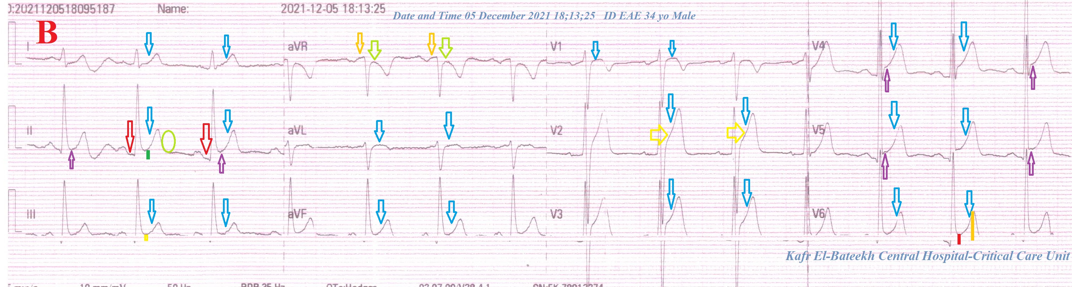
Figure 1: A-ECG tracing was done on the initial presentation showing NSR (VR; 81) with widespread concave upward ST-segment elevation (light blue arrows), downsloping TP-segment (Spodick sign; ovoid lime circle), ST-segment depression in aVR lead (lime arrows), PR-segment elevation in aVR lead (orange arrows), PR-segment depression (red arrows) in other leads, and the amplitude of ST-segment elevation (in mm) in lead II lead more than III lead (green and golden rectangles). There is evidence of a Wavy triple electrocardiographic sign (Yasser’s sign) of hypocalcemia in V4-6 (orange, dark blue, and green arrows), malignant repolarization pattern in II, and V4-6 leads (pink arrows), and normal variant T-wave in V2. B-ECG tracing was done within 3 minutes of the above initial presentation showing NSR (VR; 84), the ratio of ST-segment elevation to T-wave amplitude (in mm) in lead V6 more than 0.25 (red and golden rectangles), with the same other changes but with the disappearance of the Wavy triple an electrocardiographic sign (Yasser’s sign) of hypocalcemia.
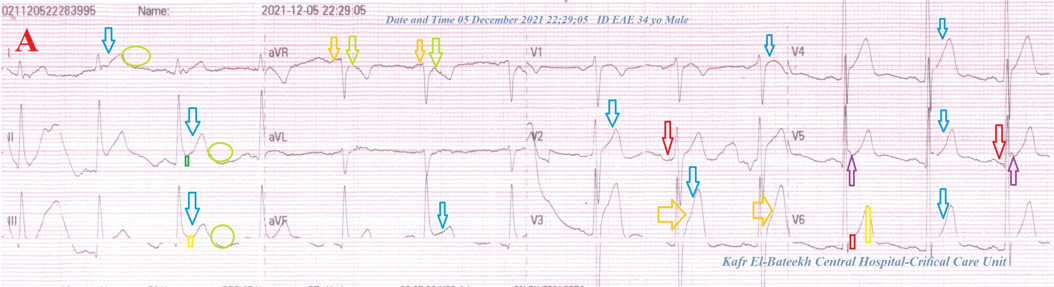
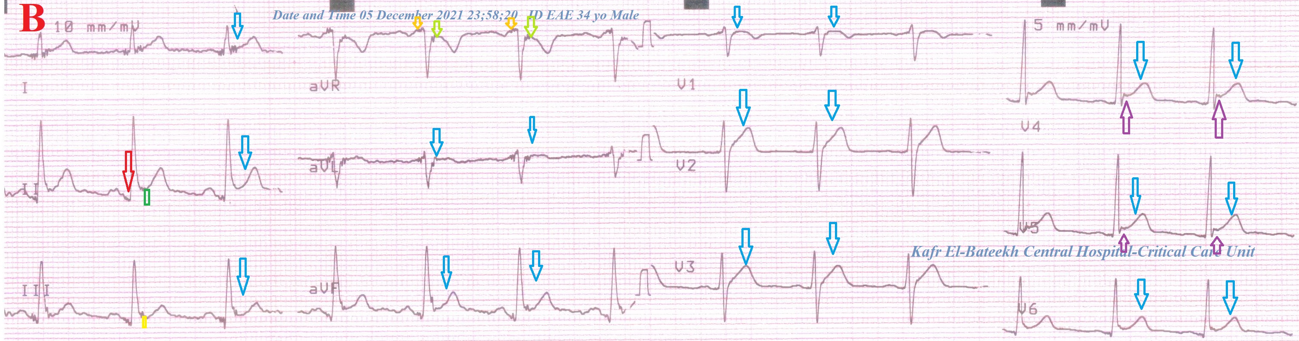
Figure 2: A-ECG tracing was done within 4 hours of the above initial presentation showing NSR (VR; 76) with the same initial changes but with the disappearance of the Wavy triple electrocardiographic sign (Yasser’s sign) of hypocalcemia. B-ECG tracing was done within 6 hours of the above initial presentation showing NSR (VR; 86) with slight diminution of the initial widespread concave upward ST-segment elevation.
DISCUSSION
Overview
A 34-year-old worker heavy smoker married Egyptian male patient was admitted to the critical care department with severe chest pain and acute pericarditis.
• The objective primary for my case study was the presence of acute pericarditis with a Movable-weaning phenomenon (Yasser’s phenomenon) and variant T-wave in underlying repolarization pattern in the admitted ICU patient.
• The secondary objective for the current case report was the hypothetical questions; what is about this association? Why is this significant problem? How did you manage this case?
• There was a history of acute chest pain that was stabbing, sharp, retrosternal, pericardial, radiating to left shoulder, improved on sitting up, worsen in supine position and inspiration with listen to pericardial rub and strong ECG evidence is suggestive of acute pericarditis.
• The presence of the initial ECG tracing showed widespread concave upward ST segment elevation, PR-segment depression, ST-segment elevation lead II lead >III, ST-segment depression in aVR, Spodick's sign, Checkmark ST-segment, convex ST-segment in V2 and V3, PR-segment elevation in aVR are seen in the current ECG. All these signs appear variably in acute pericarditis.
• Movable phenomenon or Yasser’s phenomenon of hypocalcemia is pivotal for tachypnea in this case report.
• The presence of a repolarization pattern in anterior leads only indicates is the benign form.
• An upright highest T-wave in V2 and 3 leads which varies than ST-segment elevation of acute pericarditis is a normal variant in this young patient.
• ST-segment elevation myocardial infarction (STEMI), coronary artery spasm (CAS), and pulmonary embolism were the most probable electrocardiographic differential diagnosis for the current case study. In CAS or STEMI, there are no pathologic Q-waves, but convex regional ST-segment elevations and reciprocal changes are present. ECG signs are surely against the diagnosis of acute pulmonary embolism.
• There are no selection criteria because it is a retrospective-observational case study.
• Due to extremity rare of this co-association, it is difficult to be generalization.
• I can’t compare the current case with similar conditions. There are no similar or known cases with the same management for near comparison.
• Due to higher costs for the patient, coronary angiography and Heart-CT coronary angiography are considered a study limitation for the current case study.
CONCLUSION AND RECOMMENDATIONS
• Diversity of electrocardiographic signs of acute pericarditis with Movable-weaning phenomenon or Yasser’s phenomenon and repolarization pattern are newly described.
• An upright highest normal variant T-wave in V2 and 3 leads may be help in differential diagnosis.
• The presence of a repolarization pattern has a prognostic value in this case.
• Viral infection may be implicated in the current acute pericarditis.
CONFLICTS OF INTEREST
There are no conflicts of interest.
ACKNOWLEDGMENT
I wish to thank the nurse team of the intensive care unit in Kafr-El-Bateeck Central Hospital to give me extra copies of the ECG to help me.
REFERENCES
- Snyder JM, Bepko J, White M. (2014). Acute Pericarditis: Diagnosis and Management. Am Fam Physician. 89(7):553-560.
- Burns Ed, Buttner R. (2021). Pericarditis. Ecg-library.
- Witting MD, Hu KM, Westreich AA, Tewelde S, Farzad A, Mattu A. (2020). Evaluation of Spodick's Sign and Other Electrocardiographic Findings as Indicators of STEMI and Pericarditis. J Emerg Med. 58(4):562-569.
- Buttner R, Cadogan M. (2022). Spodick sign.
- Elsayed YMH. (2021). Movable-Weaning off an Electrocardiographic Phenomenon in Hypocalcemia (Changeable Phenomenon or Yasser’s Phenomenon of Hypocalcemia)-Retrospective-Observational Study. CPQ Medicine. 11(1):01-35.
- Elsayed YMH. (2021). A COVID-19 extensive bilateral pneumonia, variants ischemic heart disease, and Movable-weaning phenomenon of hypocalcemia or Yasser’s phenomenon; dramatic reversal at home management. J Clin Images Med Case Rep. 2(2):1035.
- Elsayed YMH. (2019). Wavy Triple an Electrocardiographic Sign (Yasser Sign) in Hypocalcemia. A Novel Diagnostic Sign; Retrospective Observational Study. EC. 3(2):1-2.
- Elsayed YMH. (2020). Hypocalcemia-induced Camel-hump T-wave, Tee-Pee sign, and Bradycardia in a Car-painter of a Complexed Dilemma: A Case Report. Cardiac. 2(1):07.
- Rosso R, Viskin S. (2020). Benign Versus Malignant Early Repolarization Patterns. In: El-Sherif, N. (eds) Cardiac Repolarization. Springer, Cham:277–283.
- Lin W, Teo SW, Poh KK. (2013). Electrocardiographic T wave abnormalities. Singapore Med J. 54 (11):606–610.