Previous Issues Volume 4, Issue 1 - 2019
Long-term prognosis related to fasting total-cholesterol and triglyceride levels after TIA/stroke
Sven-Erik Eriksson
Division of Neurology, Department of Medicine, Falun Hospital, S-791 82 Falun, Sweden
Corresponding Author: Sven-Erik Eriksson, Division of Neurology, Department of Medicine, Falun Hospital, S-791 82 Falun, Sweden
Received Date: Mar 10, 2019 Published Date: May 31, 2019 Copyright © 2019 Sven-Erik E Citation: Sven-Erik E. (2019). Long-Term Prognosis Related to Fasting Total-Cholesterol and Triglyceride Levels After TIA/Stroke. Mathews J Neurol 4(1): 14.
ABSTRACT
Background and Aim: To identify statistically significant differences in the risk of (recurrent) stroke, myocardial infarction (MI), or mortality between groups with different levels of fasting total–cholesterol (TC) and triglyceride (TG).
Material and Methods: A total of 124 men and 96 women who were hospitalized in 1986 either at the Stroke Unit or Department of Neurology, Linköping, had their lipid levels assessed at admission and received follow-up retro-/prospectively until February 2011.
Results: Men had an almost linear correlation between increasing TC levels (< 5 mmol/L; 5-6.4 mmol/L; and ≥ 6.5 mmol/L), and increasing risk of MI during life, P = 0.016, and cardiovascular death (CVD) (not index stroke), P = 0.002; women had a U-shaped correlation. Men had an inverse correlation between TC levels and death due to cancer, P=0.008. Comparisons pairwise between sexes: TC 5-6.4 mmol/L, increased survival in women, P=0.038. According to Cox regression analyses, TC ≥ 6.5 mmol/L was a predictor of MI, and TG > 2.2 mmol/L had an unfavourable effect on survival.
Conclusions: TC and TG levels measured after admission effect men and women differently regarding the risk for MI and CVD. These differences of outcomes between sexes may support the fact that the indication for lipid-lowering treatment is partly dependent on sex.
Keywords: Total-Cholesterol; Fasting-Triglycerides; Recurrent Stroke; Myocardial Infarction; Cancer; Survival
INTRODUCTION
A linear relationship between increasing total-cholesterol (TC) levels and increasing risk of lethal myocardial infarction (MI) has been demonstrated in men from Northern Europe and the USA [1-9], but this relationship is weaker in women [1, 6, 8-9] or no correlation has been shown [10, 11]. Several studies have reported both relationship and lack of an association between increasing TC levels and increasing risk of ischemic stroke and stroke mortality [3, 4, 8, 12]. Some studies have suggested a correlation between increasing TC levels and increasing total mortality in those aged < 50 years [8, 13, 14]. Other studies have reported a flat relationship in women between TC levels and total mortality but a U-like relationship in men due to an increased risk of for example cancer at low TC levels [6].
Triglycerides (TG) have been reported to be a risk factor for MI [9, 10], MI and all-cause mortality in both men and women [15], compared to other studies where TG is reported as a risk factor only in women for MI [11, 16] and all-cause mortality [8, 11, 16].
The introduction of statins [17] markedly changed lipidlowering treatment because of their positive effects on lowering the risk of stroke [5, 18-20], MI, and major vascular events in both sexes [5, 19-21], but the positive effect on survival differs between studies [5, 18, 19, 21- 23].
The purpose with this retrospective study was to determine if there were statistically significant differences in the risk of (recurrent) stroke, MI, or mortality between the sexes and between groups with different levels of TC and TG.
MATERIAL AND METHODS
This study included patients with TIA/stroke hospitalized in 1986 at the Stroke unit or Department of Neurology and who had a fasting lipid analysis performed at admission. All patients were followed up until February 2011 [24]. TIA was defined as an acute onset of focal neurological symptom(s) and sign(s) or retinal that had been transient within 24 hours. The diagnosis of MI was assessed by electrocardiogram (ECG), and the presence of elevated cardiac enzymes and usually the patients had had ischemic symptoms, or the diagnosis was verified by morphologic findings that included angiographic abnormalities compatible with MI. Malignant cancer data were from journals and the Swedish cancer register established 1958 to 2010 (excluding basal cells carcinoma), after permission from the National Board of Health and Welfare, Stockholm, Sweden. Cause of death was based on the underlying cause defined by the World Health Organization (WHO) as a disorder that started the chain of events that led to death. TC levels were classified into three categories: < 5 mmol/L; 5-6.4 mmol/L; and ≥ 6.5 mmol/L; TG values were classified into three categories: < 1.6 mmol/L; 1.6-2.2 mmol/L; and ≥2.3 mmol/L. Fasting cholesterol (TC)/triglyceride (TG) values were performed in 66% of those patients who survived the first month and were below 75 years of age. Different outcomes were analysed irrespectively whether patients had received lipid-lowering treatment some time or not. After the first 12 years, an evaluation of any effects of lipid-lowering drugs was performed. However, this analysis also included patients who did not have their TC/TG values measured at admission.
STATISTICAL ANALYSIS
Statistical analyses were performed using the IBM SPSS for Windows, v 24. The Student’s t-test, x2-test corrected with Bonferroni’s methods, Mann-Whitney U-test, and analysis of variance (ANOVA) test were performed. The Kaplan-Meier life table technique was used to estimate the risk of first event of stroke, MI, and the surviving proportion, and the log rank test was used to analyse differences in the occurrence of events between the subgroups. A Cox proportional hazards regression model, which analysed different risk factors/first line treatments, was used to assess the odds ratios (ORs) of a recurrent stroke, MI, and death in patients admitted due to TIA/ischemic stroke. Age was a continuous variable with a linear increase in risk each year. Systolic/diastolic blood pressure was a continuous variable with a linear increase in risk per mm Hg increase in blood pressure.
RESULTS
Baseline characteristics
A total of 224 patients, which included 96 women, were classified into three different subgroups of TC and were compared to patients without assessed fasting TC values. The patients’ baseline characteristics are shown in Table 1. Angiography and/or doppler of the symptomatic carotid artery showed > 50% stenosis/occlusion in 2/7 (29%) of men and 1/2 (50%) women with TC <5 mmol/L, 7/18 (39%) men and 3/14 (22%) women with TC 5-6.4 mmol/L, and 9/17 (53%) men and 2/11 (18%) women with TC levels >6.4 mmol/L. Higher TG levels correlated to a higher risk of a fasting blood glucose level ≥ 6.1 mmol/L at admission or a history of diabetes in both men and women, P=0.026 and P=0.012, respectively.
Table 1: Baseline characteristics.
|
Men |
Women |
|||||||||||
|
Fasting S-choles terol |
<5 mmol/L n=23 |
5-6.4 mmol/L n=54 |
≥6.5 mmol/L n=47 |
Sign |
Missing n=164 |
Fasting S-choles terol vs missing Sign. |
<5 mmol/L n=13 |
5-6.4 mmol/L n=42 |
≥6.5 mmol/L n=41 |
Sign |
Missing n=165 |
Fasting S-choles terol vs missing Sign. |
|
Age range (years) Mean, median |
47-77 67, 68 |
44-86 65.2, 66.5 |
39-75 63.1, 65 |
ns |
39-91 73.4, 76 |
0.000 |
43-75 65.9, 67 |
37-78 63, 67 |
45-76 66.4, 69 |
ns |
36-96 76.4, 78.7 |
0.000 |
|
(%) ≤54 55-74 ≥75 |
13 83 4 |
11 80 9 |
13 83 4 |
ns |
5 38 57 |
0.000 |
15 77 8 |
21 72 7 |
12 78 10 |
ns |
4 24 72 |
0.000 |
|
Diagnosis, (%) Transient ischemic attack (TIA) Atherosclerotic cerebral infarction (ACI) Cardioembolic cerebral infarction (CE) Lacunar infarction (LI) Intracerebral haemorrhage (ICH) |
17 44 9 22 9 |
15 65 4 13 4 |
17 47 15 15 6 |
ns |
9 52 18 10 12 |
0.014 |
8 62 23 0 8 |
12 62 12 12 2 |
10 63 10 15 2 |
ns |
4 50 26 7 13 |
0.001 |
|
Severity, (%) TIA TIA1 Minor stroke Moderate stroke Major stroke |
13 52 17 17 |
7 59 17 17 |
15 45 19 21 |
ns |
4 37 20 40 |
0.000 |
8 31 39 23 |
10 52 12 26 |
7 54 20 20 |
ns |
4 36 16 44 |
0.004 |
|
History of malignant cancer, (%) |
9 |
4 |
2 |
ns |
9 |
ns |
15 |
19 |
17 |
ns |
13 |
ns |
|
Lowered level of consciousness, (%) |
0 |
0 |
2 |
ns |
8 |
0.005 |
0 |
2 |
5 |
ns |
12 |
0.013 |
|
Fasting blood glucose ≥6.1 mmol/L or history of diabetes, (%) |
30 |
32 |
34 |
ns |
42 |
ns |
46 |
26 |
46 |
ns |
53 |
0.014 |
|
History of diabetes, (%) |
22 |
26 |
13 |
ns |
16 |
ns |
23 |
14 |
15 |
ns |
23 |
ns |
|
Fasting blood glucose, missing, (%) |
0 |
6 |
4 |
ns |
10 |
ns |
0 |
10 |
0 |
ns |
12 |
0.032 |
|
History of myocardial infarction or pathological Q waves on ECG, (%) |
13 |
24 |
32 |
ns |
26 |
ns |
0 |
10 |
15 |
ns |
21 |
0.034 |
|
Fasting S-cholesterol (SD) |
4.4 (0.4) |
5.7 (0.4) |
7.6 (1) |
0.000 |
unk |
4.4 (0.3) |
5.7 (0.4) |
7.5 (1) |
0.000 |
unk |
||
|
Fasting triglycerides (SD)2 |
1.36(0.86) |
1.66(1.15) |
2.1(10.09) |
0.020 |
unk |
1.24(0.69) |
1.6(0.86) |
1.94(10.01) |
0.036 |
unk |
||
|
Fasting S-triglycerides a, (%) <1.6 mmol/L 1.6-2.2 mmol/L ≥2.3 mmol/L |
70 22 9 |
63 20 17 |
37 28 35 |
0.027 |
unk |
85 0 15 |
55 26 19 |
46 20 34 |
0.074 |
unk |
||
|
AF on ECG, (%) Missing, (%) |
9 0 |
4 4 |
11 4 |
ns |
24 9 |
0.000 |
33 8 |
14 0 |
8 3 |
ns |
29 9 |
0.005 |
|
Previous stroke, (%) |
22 |
30 |
30 |
ns |
31 |
ns |
15 |
29 |
24 |
ns |
21 |
ns |
|
History of angina pectoris, (%) |
13 |
13 |
21 |
ns |
18 |
ns |
0 |
7 |
7 |
ns |
12 |
ns |
|
Heart failure, (%) |
22 |
24 |
20 |
ns |
37 |
0.005 |
23 |
32 |
24 |
ns |
47 |
0.001 |
|
History of claudiocation intermittens, (%) |
4 |
7 |
6 |
ns |
7 |
ns |
18 |
5 |
5 |
ns |
4 |
ns |
|
Blood pressure at admission, mm Hg Systolic (SD) Diastolic (SD) |
162.6 (21.4) 90 (13) |
164.2 (30.5) 90.9 (14.9) |
160.1 (27.2) 92.9 (12.1) |
ns ns |
165.7 (30.3) 91.1 (13.8) |
ns ns |
168.1 (38.8) 91.9 (12.7) |
158.9 (28.5) 89 (13.6) |
168.4 (30.8) 93.3 (9.4) |
ns ns |
175 (31.1) 92.1 (13.2) |
0.007 ns |
|
Known hypertension or treatment with antihypertensive drugs during hospitalization, (%) |
61 |
65 |
66 |
ns |
67 |
ns |
69 |
64 |
71 |
ns |
82 |
0.009 |
|
Blood pressure ≥140/90 mm Hg at admission or treatment with antihypertensive drugs, (%) |
91 |
89 |
96 |
ns |
95 |
ns |
85 |
88 |
93 |
ns |
96 |
ns |
|
CT-scan, n Visible infarction, (%) No One Multiple Visible LI Leukoaraiosis |
19 42 16 42 32 26 |
46 39 46 15 11 24 |
36 28 39 33 25 6 |
ns ns ns |
94 30 31 39 31 23 |
ns ns ns |
8 50 50 0 0 13 |
36 44 47 8 19 22 |
36 31 44 25 19 25 |
ns ns ns |
78 33 37 30 26 22 |
ns ns ns |
1Neurological signs at admission;2 M, n=123; F, n=96
a men ≥6.5 mmol/L; one missing
Stroke and myocardial infarction
During the observation time, 68 men had 110 strokes, 40 men had 73 MIs, 44 women had 62 strokes, and 28 women had 44 MIs. Table 2 summarizes the risk of a (recurrent) stroke or MI according to Kaplan-Meier analyses. The occurrence of stroke previously, during the observation time, and both were documented in the different subgroups: TC, men 65%, 61%, and 72% (ns), respectively, women, 62%, 55%, and 63% (ns) respectively; TG, men 69%, 72%, and 52 % ( ns), respectively; women, 57%, 58%, and 67%, (ns) respectively. A linear relationship between the three TC levels and the frequency of MI during life was observed in men with increasing TC levels: 26%, 43%, and 62%, P=0.014, (1 vs. 2, ns; 1 vs. 3, P=0.01; 2 vs. 3, ns); owever, this relationship was U-shaped in women: 39 %; 29% and 42 %, (ns). Analysis of three TG levels and corresponding frequency of MI was: men 45%; 38% and 59% (ns), respectively; women 28%; 47% and 42% (ns), respectively. Analysis of TC levels 5-5.4 mmol/L, 5.5-5.9 mmol/L, 6-6.4 mmol/L, showed the frequency of MI during life was: men 39%; 35%, 56%, respectively; women, 17%, 41%, 23%, respectively.
Table 2: Kaplan-Meier estimates of probabilities of first event of stroke and myocardial infarction in men and women depending on total-cholesterol and triglyceride levels after admission, 1986-2011.
|
Total-cholesterol Stroke1 |
Total-cholesterol MI2 |
|||||
|
<5 mmol/L Cumulative risk %,95% CI |
5-6.4mmol/L Cumulative risk %,95% CI |
≥6.5mmol/L Cumulative risk %, 95% CI |
<5 mmol/L Cumulative risk %,95% CI |
5-6.4mmol/L Cumulative risk %,95% CI |
≥6.5mmol/L Cumulative risk %,95% CI |
|
|
Men |
||||||
|
1 month |
0 |
1.9(0-5.4) |
4.3(0-10) |
0 |
1.9(0-5.4) |
2.1(0-6.2) |
|
3 months |
0 |
3.9(0-9.2) |
4.3(0-10) |
0 |
1.9(0-5.4) |
2.1(0-6.2) |
|
6 months |
4.3(0-12.7) |
5.9(0-12.4) |
6.5(0-13.6) |
4.3(0-12.7) |
1.9(0-5.4) |
2.1(0-6.2) |
|
1 year |
8.7(0-20.3) |
12(3-21) |
10.9(1.9-19.9) |
4.3(0-12.7) |
3.7(0-8.8) |
6.4(0-13.5) |
|
2 years |
21.7(4.8-38.6) |
18.2(7.4-29) |
20.3(8.4-32.3) |
8.7(0-20.3) |
5.6(0-11.7) |
8.5(0.5-16.5) |
|
5 years |
34.8(15.4-54.2) |
29.2(16.3-42.1) |
34.4(20.3-48.5) |
13(0-26.7) |
14.8(5.4-24.2) |
19.1(7.9-30.2) |
|
10 years |
44.1(20.4-67.8) |
42.3(27.6-57) |
54.6(39.3-69.9) |
17.4(2-32.9) |
18.5(8.1-28.9) |
40.4(26.3-54.5) |
|
15 years |
62.7(36.2-89.2) |
58.8(41.6-76) |
77.3(62.4-92.2) |
21.7(4.8-38.5) |
18.5(8.1-28.9) |
42.6(28.5-56.7) |
|
20 years |
62.7(36.2-89.2) |
69.1(51.3-86.9) |
81.1(67-95.2) |
21.7(4.8-38.5) |
18.5(8.1-28.9) |
46.8(32.5-61.1) |
|
Total |
62.7(36.2-89.2) |
84.6(67-100) |
81.1(67-95.2) |
21.7(4.8-38.5) |
24.1(12.7-35.5) |
46.8(32.5-61.1) |
|
Women |
||||||
|
1 month |
0 |
4.8(0-11.3) |
2.4(0-7.1) |
7.7(0-22.2) |
0 |
0 |
|
3 months |
0 |
4.8(0-11.3) |
5(0-11.9) |
7.7(0-22.2) |
0 |
2.4(0-7.1) |
|
6 months |
0 |
12.3(2.4-22.2) |
5(0-11.9) |
7.7(0-22.2) |
4.8(0-11.3) |
4.9(0-11.5) |
|
1 year |
7.7(0-22.2) |
17.3(5.5-29.1) |
7.7(0-16.1) |
7.7(0-22.2) |
4.8(0-11.3) |
12.2(2.3-22.1) |
|
2 years |
15.4(0-35) |
25(11.5-38.5) |
13.3(2.3-24.3) |
7.7(0-22.2) |
7.1(0-14.9) |
12.2(2.3-22.1) |
|
5 years |
32.3(6-58.6) |
27.8(13.7-41.9) |
27.8(13.1-42.5) |
15.4(0-35) |
7.1(0-14.9) |
14.6(3.8-25.4) |
|
10 years |
51.6(22.2-81) |
31(16.3-45.7) |
45.8(29.1-62.5) |
15.4(0-35) |
14.3(3.7-24.9) |
24.4(11.3-37.5) |
|
15 years |
51.6(22.2-81) |
38.6(22.1-55.1) |
45.8(29.1-62.5) |
30.8(5.8-55.9) |
16.7(5.3-28) |
26.8(13.3-40.3) |
|
20 years |
51.6(22.2-81) |
50.9(32.9-68.9) |
65.5(46.9-84.1) |
30.8(5.8-55.9) |
19(7.1-30.9) |
31.7(17.4-46) |
|
Total |
51.6(22.2-81) |
55.8(37.2-74.4) |
65.5(46.9-84.1) |
38.5(12-65) |
21.4(9.1-33.7) |
34.1(19.6-48.6) |
|
Triglycerides Stroke1 |
Triglycerides MI2 |
|||||
|
Men |
<1.6 mmol/L |
1.6-2.2 mmol/L |
≥2.3 mmol/L |
<1.6 mmol/L |
1.6-2.2 mmol/L |
≥2.3 mmol/L |
|
1 month |
1.5(0-4.4) |
3.4(0-10) |
3.7(0-10.8) |
3(0-7.1) |
0 |
0 |
|
3 months |
3.1(0-7.4) |
3.4(0-10) |
3.7(0-10.8) |
3(0-7.1) |
0 |
0 |
|
6 months |
4.8(0-10.1) |
6.9(0-16.1) |
7.4(0-17.2) |
4.5(0-9.4) |
0 |
0 |
|
1 year |
11.5(3.5-19.5) |
10.3(0-21.4) |
11.1(0-22.9) |
6(0.3-11.7) |
6.9(0-16.1) |
0 |
|
2 years |
19.8(9.8-29.8) |
10.3(0-21.4) |
29.6(12.4-46.9) |
7.5(1.2-13.8) |
10.3(0-21.5) |
3.7(0-10.7) |
|
5 years |
31.5(19.7-43.3) |
34.8(16.2-53.4) |
33.5(15.7-51.3) |
14.9(6.3-23.5) |
13.8(1.3-26.3) |
18.5(3.8-33.2) |
|
10 years |
53.6(39.9-67.3) |
44.8(24.6-65) |
38(19.4-56.6) |
23.9(13.8-34) |
20.7(6-35.4) |
37(18.8-55.2) |
|
15 years |
70.2(55.5-84.9) |
61.4(40.3-82.5) |
69(45.5-92.5) |
25.4(15-35.8) |
24.1(8.6-39.6) |
37(18.8-55.2) |
|
20 years |
78.7(64.2-93.2) |
74.3(49.4-99.2) |
69(45.5-92.5) |
26.9(16.3-37.5) |
24.1(8.6-39.6) |
40.7(22.1-59.3) |
|
Total |
89.4(76.7-100) |
74.3(49.4-99.2) |
69(45.5-92.5) |
31.3(20.1-42.5) |
24.1(8.6-39.6) |
40.7(22.1-59.3) |
|
Women |
||||||
|
1 month |
1.9(0-5.6) |
0 |
8.3(0-19.3) |
0 |
0 |
4.2(0-12.2) |
|
3 months |
1.9(0-5.6) |
0 |
12.9(0-26.6) |
0 |
5.3(0-15.3) |
4.2(0-12.2) |
|
6 months |
3.8(0-8.9) |
6.2(0-18.2) |
17.5(1.8-33.2) |
0 |
10.5(0-24.2) |
12.5(0-25.8) |
|
1 year |
9.4(1.6-17.2) |
6.2(0-18.2) |
22.1(4.9-39.3) |
1.9(0-5.6) |
15.8(0-32.3) |
16.7(1.8-31.6) |
|
2 years |
15.2(5.4-25) |
6.2(0-18.2) |
36.7(16.3-57.1) |
1.9(0-5.6) |
21.1(2.7-39.5) |
16.7(1.8-31.6 |
|
5 years |
23.1(11.5-34.7) |
20.7(0-41.7) |
48.2(26.2-70.2) |
5.7(0-12) |
21.1(2.7-39.5) |
16.7(1.8-31.6 |
|
10 years |
35.9(22.6-49.2) |
29.5(4.8-54.2) |
59.7(37.7-81.7) |
11.3(2.7-19.9) |
26.3(6.5-46.1) |
29.2(11-47.4) |
|
15 years |
38.5(24.8-52.2) |
39.6(11.6-67.6) |
59.7(37.7-81.7) |
18.9(8.3-29.5) |
26.3(6.5-46.1) |
29.2(11-47.4) |
|
20 years |
59(43.5-74.5) |
39.6(11.6-67.6) |
59.7(37.7-81.7) |
20.8(9.8-31.8) |
36.8(15.1-58.6) |
29.2(11-47.4) |
|
Total |
59(43.5-74.5) |
51.6(20.8-82.4) |
59.7(37.7-81.7) |
24.5(12.9-36.1) |
36.8(15.1-58.6) |
33.3(14.5-52.1) |
|
1Long-term outcomes were not significantly different among included subgroups (log rank test) for total-cholesterol, between sexes and compared overall pooled. Long-term outcomes were not significantly different among included subgroups (log rank test) for triglycerides and overall pooled, but were between sexes: TG <1.6 mmol/L, P=0.011. 2 Long-term outcomes were significantly different among included subgroups (log rank test): men, TC 5-6.4 mmol/L vs. TC≥6.5 mmol/L, P=0.020. No differences between TC and sexes. Compared overall pooled, P=0.028. Long-term outcomes were not significantly different among included subgroups (log rank test) for TG, between sexes, and compared overall pooled. |
||||||
Annual risk of stroke, MI in patients with and without malignant cancer
Men with TC ≥ 6.5 mmol/L had a significantly lower incidence of malignant cancer than men <6.5 mmol/L, P=0.004. Patients with malignant cancer had a lower annual risk of MI and stroke compared to patients without cancer in the different subclasses of TC and TG levels except: TC <5mmol/L for MI in men, TC >6.4 mmol/L for stroke in men, TC ≥ 5 mmol/L for stroke in women, and TG < 2.3 mmol/L for stroke in women (Table 3).
Table 3: Fasting S-total cholesterol and triglyceride levels and risks of MI and stroke in patients with and without malignant cancer.
|
Sex |
Men |
Women |
||||||
|
Fasting S-total-cholesterol |
<5 mmol/L n=23 |
5-6.4 mmol/L n=54 |
≥6.5 mmol/L n=47 |
Sign. |
<5 mmol/L n=13 |
5-6.4 mmol/L n=42 |
≥6.5 mmol/L n=41 |
Sign. |
|
Malignant cancer (previously, during the observation time, or both), n, % |
8(2; 5; 1) 35 |
19(2; 17; 0) 35 |
9(1; 8; 0) 19 |
Ns |
3(2; 1; 0) 23 |
15(8; 7; 0) 36 |
12(7; 5; 0) 29 |
ns |
|
Myocardial infarction (during the observation time) Cancer patients, n (%) Non-cancer patients, n (%) Annually (%/year) Cancer patients Non-cancer patients |
2(25) 3(20) 9.1 2.1 |
4(21) 9(26) 2.5 5.4 |
4(44) 18(47) 5.4 7.9 |
ns ns |
1(33) 4(40) 2.9 9 |
2(13) 7(26) 0.8 2.4 |
3(25) 11(38) 0.8 6 |
ns ns |
|
Recurrent stroke (during the observation time) Cancer patients, n (%) Non-cancer patients, n (%) Annually (%/year) Cancer patients Non-cancer patients |
3(38) 8(53) 6 9.7 |
5(26) 22(63) 3.5 11.6 |
7(78) 23(61) 11.9 7.5 |
0.040 ns |
1(33) 5(50) 2.9 6.3 |
7(47) 11(41) 5.5 4.1 |
8(67) 12(41) 7.5 5.6 |
ns ns |
|
Fasting S-triglycerides Age, range, (years) Mean, median |
<1.6 mmol/L n=67 44-86 66.1, 68 |
1.6-2.2 mmol/L n=29 39-75 65.1, 66 |
≥2.3 mmol/L n=27 44-74 60.9, 61 |
Sign 0.0261 |
<1.6 mmol/L n=53 37-75 64, 67 |
1.6-2.2 mmol/L n=19 51-76 68.1, 70 |
≥2.3 mmol/L n=24 51-76 64.2, 67.5 |
Sign. ns |
|
Malignant cancer (previously, during the observation time or both), n, % |
19(2, 16, 1) 28 |
8( 2, 6, 0) 28 |
9(1, 8, 0) 33 |
Ns |
17(8, 9, 0) 32 |
4(3, 1, 0) 21 |
9(6, 3, 0) 38 |
ns |
|
Myocardial infarction (during the observation time) Cancer patients, n, (%) Non-cancer patients, n, (%) Annually (%/year) Cancer patients Non-cancer patients |
4 (21) 17(35) 5.3 6.4 |
2(25) 5(24) 2.1 5.7 |
4(44) 7(39) 5 5.6 |
ns ns |
2(12) 11(31) 0.8 3.9 |
1(25) 6(40) 1.5 4.3 |
3(33) 5(33) 3.8 10.2 |
ns ns |
|
Recurrent stroke (during the observation time) Cancer patients, n, (%) Non-cancer patients, n, (%) Annually (%/year) Cancer patients Non-cancer patients |
8(42) 30(63) 7 9.1 |
2(25) 13(62) 3.1 11.4 |
5(56) 9(50) 7 7.9 |
ns ns |
9(53) 17(47) 5.2 4.7 |
2(50) 4(27) 4.6 3.1 |
4(44) 8(53) 7.6 8.7 |
ns ns |
1 v 3, P=0.007
Survival
Kaplan-Meier estimates of survival probabilities dependent on fasting TC/TG levels at admission in men and women between 1986-2011, are given in Table 4. No significant differences in survival between the TC subgroups were observed: 111 male deaths (mean age, 95% confidence intervals [CI]) 75.8(72.8- 78.7), 75(72.6-77.5), and 74.3(72.1-76.3), respectively; 76 female deaths 76.7(72.1-81.3), 77.4(73.8-81), and 76.1(72.3-78.9) (ANOVA), respectively. Death in men by recurrent stroke or by other vascular causes increased with an increase in TC levels: 44%; 59%; 83%, P=0.002 (1 vs. 2, ns; 1 vs. 3, P=0.002; 2 vs. 3, P=0.016).
The corresponding annual risks in men were 4.8, 5.8, and 7.3, respectively, compared to 6.2, 3.6, and 5.7 in women, respectively. Death due to cancer was inversely related to TC levels in men, P=0.008, (1 vs. 3, P=0.004; 2 vs. 3, ns; 1 vs. 2, ns). TC levels were classified into 6 subgroups for all-cause mortality and vascular causes of death: ≤4.9 mmol/L, 5-5.9 mmol/L, 6-6.9 mmol/L,7-7.9 mmol/L, 8-8.9 mmol/L, and ≥9 mmol/L. All-cause mortality in women was 85%, 83%, 69%, 88%, 83%, and 80%, respectively, and in men was 91%, 87%, 97%, 83%, 88%, and 83%, respectively. Vascular cause of death (not index stroke) in women was 69%, 59%, 46% , 65% , 67%, and 60%, respectively, and in men was 44%, 50%, 87%, 83%; 63% and 83%, respectively.
Table 4: Kaplan-Meier estimates of probabilities of survival in men and women depending on total-cholesterol and triglyceride levels after admission, 1986-2011.
|
Total-cholesterol |
Triglycerides |
|||||
|
Survival |
<5 mmol/L Cumulative risk %, 95% CI |
5-6.4mmol/L Cumulative risk %, 95% CI |
≥6.5mmol/L Cumulative risk %, 95% CI |
<1.6 mmol/L Cumulative risk %, 95% CI |
1.6-2.2 mmol/L Cumulative risk %, 95% CI |
≥2.3 mmol/L Cumulative risk %, 95% CI |
|
Men |
||||||
|
1 month |
100 |
92.6(88.6-99.7) |
95.7(90-100) |
91(84.1-97.9) |
100 |
100 |
|
3 months |
100 |
90.7(83.1-98.3) |
95.7(90-100) |
89.6(82.3-96.9) |
100 |
100 |
|
6 months |
100 |
90.7(83.1-98.3) |
95.7(90-100) |
89.6(82.3-96.9) |
100 |
100 |
|
1 year |
100 |
90.7(83.1-98.3) |
87.2(77.6-96.8) |
88.1(80.3-95.9) |
93.1(83.9-100) |
96.3(89.2-100) |
|
2 years |
95.7(87.3-100) |
81.5(71.1-91.9) |
87.2(77.6-96.8) |
86.6(78.4-94.8) |
86.2(73.7-98.7) |
85.2(71.9-98.5) |
|
5 years |
52.2(31.8-72.6) |
68.5(52.2-80.8) |
78.7(66.9-90.7) |
65.7(54.3-77.1) |
72.4(56.1-88.7) |
74.1(57.6-90.6) |
|
10 years |
43.5(23.3-63.7) |
40.7(27.6-53.8) |
53.2(38.9-67.5) |
43.3(31.3-55.3) |
55.2(37.2-73.2) |
44.4(25.6-63.2) |
|
15 years |
13(0-26.7) |
25.9(14.1-37.7) |
31.9(18.6-45.2) |
25.4(15-35.8) |
20.7(6-35.4) |
33.3(15.5-51.1) |
|
20 years |
8.7(0-20.3) |
20.4(9.6-31.2) |
14.9(4.7-25.1) |
16.4(7.6-25.2) |
13.8(2.5-26.3) |
18.5(3.8-33.2) |
|
25 years |
8.7(0-20.3) |
11.1(2.7-19.5) |
10.6(1.8-19.4) |
7.5(1.2-13.8) |
10.3(0-14.2) |
18.5(3.8-33.2 |
|
Women |
||||||
|
1 month |
100 |
97.6(92.9-100) |
95.1(88.5-100) |
100 |
94.7(84.7-100) |
91.7(80.7-100) |
|
3 months |
100 |
95.2(88.7-100) |
92.7(84.7-100) |
100 |
84.2(66.7-100) |
91.7(80.7-100) |
|
6 months |
100 |
95.2(88.7-100) |
90.2(81.2-99.2) |
100 |
78.9(60.5-97.3) |
91.7(80.7-100) |
|
1 year |
100 |
92.9(85.1-100) |
85.4(74.6-96.2) |
98.1(94.4-100) |
78.9(60.5-97.3) |
83.3(71.1-95.5) |
|
2 years |
84.6(65-100) |
88.1(78.3-97.9) |
78(65.3-90.7) |
94.3(88-100) |
73.7(53.9-93.5) |
66.7(47.9-85.5) |
|
5 years |
69.2(44.1-94.3) |
76.2(63.3-89.1) |
70.7(56.8-84.6) |
84.9(75.3-94.5) |
52.6(30.1-75.1) |
62.5(43.1-81.9) |
|
10 years |
38.5(12-65) |
57.1(42.2-72) |
43.9(28.6-59.2) |
60.4(47.3-73.5) |
47.4(24.9-69.9) |
25(7.7-42.2) |
|
15 years |
30.8(5.7-55.9) |
47.6(32.5-62.7) |
29.3(15.4-43.2) |
45.3(31.9-58.6) |
36.8(15-58.6) |
20.8(14.5-37.1) |
|
20 years |
30.8(5.7-55.9) |
38.1(23.4-52.8) |
19.5(7.4-31.7) |
32.1(19.6-44.6) |
31.6(0-64.8) |
20.8(14.5-37.1) |
|
Total |
23.1(17-46) |
26.2(12.9-39.5) |
14.6(3.8-25.4) |
24.5(12.9-36.1) |
21(2.6-39.4) |
12.5(0-25.8) |
|
Outcomes over the long term were significantly different among included subgroups (log rank test): pairwise between sexes 5-6.4 mmol/L, P=0.038. Outcomes over the long term were significantly different among included subgroups (log rank test): women, TG <1.6 mmol/L vs .TG≥ 2.3 mmol/L, P=0.017, pairwise between sexes, TG <1.6 mmol/L, P=0.004. |
||||||
Among men with diabetes/fasting blood glucose ≥ 6.1 mmol/L, male mortality was 98% compared to 86% without diabetes, (P=0.059), and female mortality figures was 92% and 72%, P=0.021, respectively. Death due to cardiovascular causes (not index stroke) relative to the 3 TG levels increased annually (%/ year) in women by 4, 5.5, and 6.8, respectively, and in men by 6.3, 6.6, and 5.9, respectively. The risk of vascular death (not index stroke) relative to the 3 TG levels was higher in men than women: 63% vs. 57%, 69% vs. 58%, 67% vs. 58%, respectively. Significant differences in survival between the TG subgroups was observed: 110 male deaths (mean age, 95% CI) 75.7 yrs. (73.7-77.7), 75.4 yrs. (72.6-78.2), and 71.9 yrs. (68.9-74.9), ns (1 vs 3; P=0.042), respectively; 76 female deaths 78.9 yrs. (75.7-82), 77.2yrs. (73.5-80.9) and 72.1 yrs. (68.9-74.4), (ANOVA), P=0.013, (1 vs. 3, P =0.003), respectively. The cause of death in the different subgroups of TC and TG in combination is given in Figure 1.
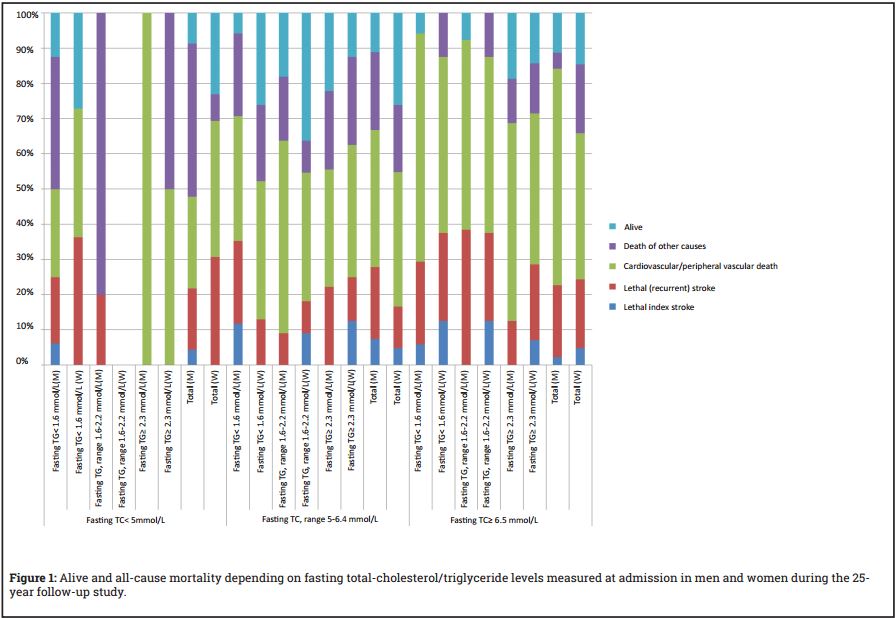
Table 5: Predictors of stroke, myocardial infarction, and death in patients with TIA/ischemic stroke.
|
Predictors |
Stroke |
MI |
Death |
|||
|
Baseline characteristics |
OR |
p-value |
OR |
p-value |
OR |
p-value |
|
Age (per year increase in age) |
1.022(0.0998-1.047) |
0.067 |
1.12(1.10-1.15) |
0.000 |
||
|
Sex1 |
0.53(0.35-0.80)’ |
0.002 |
0.66(0.48-0.92) |
0.015 |
||
|
Diagnosis2; TIA Atherosclerotic cerebral infarction Cardioembolic cerebral infarction |
1.03(0.48-2.2) 1.49(0.81-2.7) 3.78(1.8-7.9) |
0.001 0.95 0.20 0.000 |
||||
|
History of diabetes/fasting blood glucose ≥6.1 mmol/L |
1.46(0.96-2.2) |
0.077 |
1.43(0.99-2.08) |
0.059 |
||
|
Hypertension /treatment with antihypertensive drugs |
1.58(1.10-2.26) |
0.013 |
||||
|
Systolic blood pressure |
1.008(0.999-1.016) |
0.067 |
||||
|
TIA/Severity3; TIA minor stroke moderate stroke |
0.49(0.27-0.87) 0.43(0.27-0.67) 0.73(0.43-1.23) |
0.001 0.016 0.000 0.241 |
||||
|
Angina pectoris |
0.3(0.11-0.82) |
0.019 |
1.86(0.91-3.78) |
0.087 |
||
|
Previous myocardial infarction |
1.53(1.01-2.32) |
0.047 |
||||
|
Total cholesterol4; <5 mmol/L 5-6.4 mmol/L |
0.67(0.32-1.41) 0.54(0.31-0.95) |
0.095 0.29 0.034 |
||||
|
Triglycerides5 < 1.6 mmol/L 1.6 mmol/L-2.2 mmol/L |
0.47(0.3-0.72) 0.5(0.31-0.81) |
0.002 0.001 0.005 |
||||
|
First line treatment6 Anticoagulants Antiplatelet therapy |
0.42(0.26-0.69) 0.48(0.29-0.81) |
0.002 0.000 0.006 |
||||
OR=Odds ratios; 95% confidence interval in parenthesis. Stroke: 203 cases available in analysis, 103 events; Myocardial infarction: 202 cases available in analysis, 60 events; Survival: 202 cases available in analysis, 169 events 1 vs. men, 2 vs. lacunar infarction,3 vs. major stroke, 4 vs. total cholesterol ≥ 6.5 mmol/L, 5 vs. triglycerides ≥ 2.3 mmol/L, 6vs. untreated Variables considered: age, sex, diagnosis, TIA/severity of stroke, hypertension or treatment with antihypertensive drugs, systolic/diastolic blood pressure, angina pectoris, previous myocardial infarction, heart failure, atrial fibrillation, claudiocation intermittens, diabetes, history of diabetes/fasting blood glucose ≥6.1 mmol/L, fasting total cholesterol groups, fasting triglyceride groups, TIA previously, previous stroke, and first line secondary prophylactic treatment (anticoagulants, antiplatelet therapy, or untreated).
Predictors of events of stroke, MI and survival.
Table 6 summarizes the predictors for an event of stroke, MI and death, according to Cox regression analyses.
Treatment with lipid-lowering drug(s)
Only single patients were treated with lipid-lowering treatment at the admission, but at the end of the study, about 60% were treated. Lipid-lowering treatment(s) (LLT(s)) were administered 14% of the total observation time among men, 9% among women where TC value had been taken at baseline. In total, LLT(s) was administered 10% of the total observation time among men, and 9% among women.
After 12 years of observation time, 218 men had died [24], 70 men remained, of whom 25 had been treated with LLT(s) for at least 1 year; the corresponding figures in women were 202, 59, and 18, respectively. The annual risk of stroke and MI before and after the 12-year observation time for “untreated” patients was: stroke male, 3.7 vs. 8; MI male, 2.8 vs. 7.2; stroke women, 3.9 vs. 5.3; MI women, 0.8 vs. 4. The corresponding figures for patients treated with LLT(s): stroke male, 4.3 vs. 6.8; MI male, 3 vs. 4, stroke women, 2.8 vs. 3.6; MI women 0.9 vs. 0.9. At the last follow up, 12 of the 25 male patients given LLT(s) had died (cardiovascular 75%) compared to 3 of 18 female patients (cardiovascular 67%). Corresponding figures among “untreated” were 39 men (cardiovascular 69%) and 30 women (cardiovascular 73%)
DISCUSSION
In this study there was a U-like relationship in women and a linear relationship in men between TC levels and the risk of having a MI during life/ vascular death (death of a recurrent stroke or other vascular cause, not index stroke) after admission. Kaplan-Meier analysis showed MI risk was considerably higher in men with TC≥6.5 mmol/L than TC 5-6.4 mmol/L, (P=0.020) (log rank test). The U-shaped risk in women shows that low TC level can increase the risk of cardiovascular mortality/alternatively that TC level is not an effective risk marker for cardiovascular mortality in women. The women in this study with a TC level between 5-6.4 mmol/L had better survival than men, P=0.038.
The incidence of cancer was lower in the men with TC > 6.4 mmol/L, P=0.004, and death due to malignant cancer increased inversely in men, P=0.008. In a previous study it was found that men and women admitted due to TIA/stroke with cancer after admission usually had a lower annual risk of MI and stroke events compared with non-cancer patients [25]. However, this study showed that men with cancer previously, during the observation time, or both and TC levels < 5 mmol/L at admission had a higher annual risk of MI compared with male non-cancer patients and the annual risk of stroke was more common in men with TC > 6.4 mmol/L and women with TC ≥ 5 mmol/L. An increased risk of death from cancer in men with low cholesterol (TC < 4.8 mmol/L) in all aged groups statistically significant in men above 65 years old, P=0.014, and in women 50-64 year old, P=0.004 during a 15-year period have been reported [8]. Another study demonstrated that low TC value was a risk factor for increased risk of death from cancer of the liver and pancreas in men, hepatic cirrhosis, and suicide [3]. Others [6, 14] have also assessed similar results.
No significant correlations were observed between the different TG levels and risk of stroke and MI separately, but between sexes regarding stroke: TG <1.6 mmol/L, P=0.011. The women with a TG level > 2.2 mmol/L had a higher risk of death than those <1.6 mmol/L, P=0.017. At a TG level < 1.6 mmol/L, women had better survival than men, P=0.004. Men had a higher risk of mortality at the lowest TG levels and women had a higher risk of mortality at TG> 2.2 mmol/L. These results are consistent with other published Swedish studies which have reported the effect of cholesterol and triglycerides levels in men or women with ischaemic heart disease [10, 11].
The annual risk of stroke and MI was lower with lipid-lowering treatment (usually statins) compared to no treatment after 12 years follow-up in this study, which supports lipid-lowering treatment as a method to reduce the risk of stroke and MI. In total, however, this long-term observational study is mainly a study without lipid-lowering treatment.
This study supports the assumption that men with TC in the range of 5-6.4 would have greater benefit from lipid-lowering treatment compared to women. The treatment goal for men should therefore be TC <5 mmol/L, but in men with high TC levels and with a history of malignant cancer, TC range 5-6.4 mmol/L due to findings of increased annual risk of MI events at a lower TC level. The TC range of 5-6.4 mmol/L seems to be best for most women due to the U-shaped risk in women regarding the risk of MI and CVD relative to the TC level.
High fasting TG level which was shown to be a significant risk factor for CVD may require lifestyle changes with good eating habits, increased exercise, possible weight loss, review of alcohol habits, investigation of other reasons and determination of non-high-density-lipoprotein cholesterol (non-HDL-C) before lipid-lowering treatment becomes relevant. As in the previous study that did not include TC/TG levels in Cox regression analysis to assess predictors of death [24], this study also supports treatment of high systolic blood pressure, fasting blood glucose ≥6.1 mmol/L or history of diabetes, both in primary and secondary prevention, and administration of antithrombotic/antiplatelet therapy as secondary prophylaxis with no contraindications.
CONCLUSIONS
TC and TG levels measured after admission effect men and women differently regarding the risk for risk for stroke, MI, CVD and survival. These differences in outcomes between the sexes might support the fact that the indication for lipidlowering treatment is partly dependent on sex.
CONFLICTING INTERESTS
The author has no conflict of interest to disclose.
REFERENCES
1. Graff-Iversen S, Holm HA, Istad H, Ose L, et al. (1991). Treatment of hypercholesterolemia in adults. A treatment program 1991.Tidsskr Nor Laegeforen. 111(28): 3407-3411.
2. Verschuren WM, Jacobs DR, Bloemberg BP, Kromhout D, et al. (1995). Serum Total Cholesterol and long-term Coronary heart Disease Mortality in Different Cultures. JAMA. 274(2): 131-136.
3. Neaton JD, Blackburn H, Jacobs D, Kuller L, et al. (1992). Serum cholesterol level and mortality findings for men screened in the Multiple Risk Factor Intervention Trial. Multiple Risk Factor Intervention Trial Research Group. Arch Intern Med. 152(7): 1490-500.
4. Prospective Studies Collaboration, Lewington S, Whitlock G, Clarke R, et al. (2007). Blood cholesterol and vascular mortality by age, sex, and blood pressure: a meta-analysis of individual data from 61 prospective studies with 55,000 vascular deaths. Lancet. 370(9602): 1829-1839.
5. Collins R, Reith C, Emberson J, Armitage J, et al. (2016). Interpretation of the evidence for the efficacy and safety of statin therapy. Lancet. 388(10059): 2532-2561.
6. Jacobs D, Blackburn H, Higgins M, Reed D, et al. (1992). Report of the Conference on Low Blood Cholesterol: Mortality Associations. Circulation. 86(3): 1046-1060.
7. Stamler J, Wentworth D, Neaton J. (1986). for the MRFIT research Group. Is the relationship between serum cholesterol and risk of premature death from coronary heart disease continuos and graded? Findings in 356 222 primary screenees of Multiple Risk Factor Intervention Trial (MRFIT). JAMA. 256(20): 2823-2828.
8. Ulmer H, Kelleher C, Diem G and Concin H. (2004). Why Eve is not Adam: prospective follow-up in 149650 women and men of cholesterol and other risk factors related to cardiovascular and all-cause mortality. J Womens Health. 13(1): 41-53.
9. Walldius G, Jungner I, Holme I, Aastveit A, et al. (2001). High apolipoprotein B, low apolipoprotein A-1, and improvement in the prediction of fatal myocardial infarction (AMORIS study): a prospective study. Lancet. 358(9298): 2026-2033.
10. Carlson LA and Böttiger LE. (1985). Risk factors for ischaemic heart disease in men and women. Results of the 19-year follow-up of the Stockholm Prospective Study. Acta Med Scand. 218(2): 207-211.
11. Bengtsson C, Björkelund C, Lapidus L and Lissner L. (1993). Associations of serum lipid concentrations and obesity with mortality in women: 20 year follow up of participants in prospective population study in Gothenburg, Sweden. BMJ. 307(6916): 1385-1388.
12. Yaghi S and Elkind MS. (2015). Lipids and Cerebrovascular Disease: Research and Practice. Stroke. 46(12): 3322-3328.
13. Thorogood M. (1991). Risk of fatal coronary heart disease in familial hypercholesterolaemia. Scientific Steering Committee on behalf of the Simon Broome Register Group. BMJ. 303(6807): 893-896.
14. Anderson KM, Castelli WP and Levy D. (1987). Cholesterol and mortality. 30 years of follow-up from the Framingham study. JAMA. 257(16): 2176-2180.
15. Nordestgaard BG and Varbo A. (2014). Triglycerides and cardiovascular disease. Lancet. 384(9943): 626-635.
16. Stensvold I, Tverdal A, Urdal P and Graff-Iversen S. (1993). Non-fasting serum triglyceride concentration and mortality from coronary heart disease and any cause in middle aged Norwegian women. BMJ. 307(6915): 1318-1322.
17. Todd PA and Goa KL. (1990). Simvastatin, a review of its pharmacological properties and therapeutic potential in hypercholesterolemia. Drugs. 40(4): 583-607.
18. McKinney JS and Kostis WJ. (2012). Statin therapy and the risk of intracerebral hemorrhage. A metaanalysis of 31 randomized controlled trials. Stroke. 43(8): 2149-2156.
19. Cholesterol Treatment Trialists (CTT) Collaborators, Mihaylova B, Emberson J, Blackwell L, Keech A, et al.(2012). The effects of lowering LDL cholesterol with statin therapy in people at low risk of vascular disease: meta-analysis of individual data from 27 randomised trials. Lancet. 380: 581-90.
20. Collins R, Armitage J, Parish S, Sleight P, et al. (2004). Heart Protection Study Collaborative Group. Effects of cholesterol-lowering with simvastatin on stroke and other major vascular events in 20536 people with cerebrovascular disease or other high-risk conditions. Lancet. 363(9411): 757-767.
21. Wright J. (2010). Do statins have a role in primary prevention? An update. Therapeutics Initiative (Therapeutics Letter). 77.
22. Walsh JM and Pignone M. (2004). Drug treatment of hyperlipidemia in women. JAMA. 291(18): 2243-2252.
23. Kristensen ML, Christensen PM and Hallas J. (2015). The effect of statins on average survival in randomised trials, an analysis of end point postponement. BMJ. 5(9): e007118.
24. Eriksson SE. (2017). Secondary prophylactic treatment and long-term prognosis after TIA and different subtypes of stroke. A 25-year follow-up hospital-based observational study. Brain Behav. 7(1): e00603.