Information Links
Related Conferences
Current Issue Volume 8, Issue 1 - 2026
Utilizing the Sodium Tracker App Preset to 1,500 mg for Hypertension Prevention in Black Church Members
Cindy Sharp, DNP, MSN, FNP-BC, RN1,*, Alex Ariri, PhD2
1Lewis University, One University Parkway Romeoville, USA
2Project's Faculty Advisor & Editor at Lewis University, Romeoville, Illinois, USA
*Corresponding author: Mrs. Cindy Sharp, DNP, MSN, FNP-BC, RN, Lewis University, One University Parkway Romeoville, IL. 60446, USA, Email: [email protected]
Received Date: October 28, 2025
Published Date: April 20, 2026
Citation: Sharp C, et al. (2026). Utilizing the Sodium Tracker App Preset to 1,500 mg for Hypertension Prevention in Black Church Members. Mathews J Nurs. 8(1):65.
Copyrights: Sharp C, et al. © (2026).
ABSTRACT
Background: Excess sodium intake is strongly associated with the development of hypertension and remains a modifiable risk factor for its prevention. Despite this, dietary strategies that specifically monitor sodium intake are underutilized in both clinical and community settings. Objective: This quality improvement project aimed to educate Black American church members from two small congregations on monitoring sodium consumption by using the My DASH Diet Sodium Tracker App on smartphone devices. Educational sessions were supplemented with DASH diet resources, culturally relevant low-sodium recipes, nutrition label education, and videos addressing the health consequences of excessive sodium intake. Methods: A Doctor of Nursing Practice (DNP) translated a quality improvement project design where pre- and post-intervention surveys were administered to the participants. Thirty participants (N = 30) were recruited through purposive sampling from two small churches in the northwest suburbs of Illinois. Participants received training on the App usage and on adherence to a daily sodium intake of 1,500 mg over a 30-day period. Results: Participants from the first church (n = 25) demonstrated significantly greater adherence to sodium tracking, with paired sample t-test results showing a statistically significant reduction in systolic blood pressure (p < .001; 95% CI: 5.262–8.814). For the second church (n = 5), correlation analysis revealed a strong positive relationship (r = 0.9198) between intervention participation and systolic blood pressure improvement. Conclusion: Monitoring sodium intake by using a smartphone application, combined with targeted education, is a feasible, low-cost nursing intervention that can effectively reduce blood pressure in Black American church communities.
Keywords: Black Americans, Churches, Dietary Approaches to Stop Hypertension (DASH), Health Interventions, Hypertension, Smartphone Health Apps, Sodium Intake.
INTRODUCTION
Sodium is an essential electrolyte commonly consumed with foods containing table salt, sea salt, kosher salt, Himalayan salt, garlic salt, monosodium glutamate (MSG), Lawry’s seasoning, or seasoning blends as well as when eating processed foods. While the human body requires approximately 500 mg of sodium daily to maintain physiological homeostasis, excess intake remains a significant global public health concern [1]. An estimated, 1.28 million annual deaths worldwide are attributed to high sodium consumption [1]. According to researchers at the World Health Organization, on average, individuals consume up to 4,310 mg of sodium daily but are often unaware of the high levels of sodium intake or its consequences [2]. Sodium intake greater than 1,500 mg is linked to onset of hypertension, which is two to four times greater in Black Americans than in other populations [3]. Black Americans who have a diagnosis of hypertension experience cardiovascular diseases, kidney failure, stroke, myocardial infarction, and premature mortality complications decades earlier compared to other racial groups [4]. The purpose of this project was to educate Black American adults on lifestyle behavior changes that facilitate hypertension prevention by monitoring sodium intake through DASH sodium-tracking activities in a supportive church setting. This initiative promoted mindful eating habits and recommended a daily sodium intake not to exceed 1,500 mg to reduce the risk of hypertension.
One of the proposed pathophysiological factors underlying the risk of developing hypertension among Black individuals is a predisposition to salt sensitivity [5]. Other multifactorial risk factors in this population include genetics, gaps in access to healthcare, sedentary lifestyle, obesity, prolonged stress, discrimination, and socioeconomic factors [8]. Salt sensitivity can lead to a measurable rise in blood pressure with increased dietary sodium intake [5]. In affected individuals, impaired renal sodium excretion (impaired natriuresis) results in sodium and water retention, which is associated with an increased risk of hypertension [5]. Furthermore, excessive sodium intake over time can elevate blood pressure, which damages renal capillaries and glomeruli, leading to microvascular injury and progressive chronic kidney disease [5]. Hypertension also increases the risk of adverse cardiovascular complications. Black Americans consume an average of 3,500 mg of dietary sodium daily [3,7]. The recommendation to reduce sodium in Black Americans' diets to 1,500 mg is mutually supported by the American Heart Association (AHA), the Centers for Disease Control and Prevention (CDC), and the National Institute for African American Health (NIAAH); this recommendation aligns with the known facts of the chronic disease burden of hypertension affecting Black Americans [3,6,7]. Community engagement through faith-based settings is an effective way to deliver health education on sodium-restricted diets to Black individuals who might underutilize such services in physicians’ offices or other healthcare settings. Reducing dietary sodium intake is one of the simpler, yet effective modifiable strategies for improving blood pressure control.
Hypertension is considered a silent killer and affects around 20.3 million Black Americans, correlating to the high prevalence of 58% [8]. Restricting sodium intake through dietary means such as the DASH diet reduces systolic blood pressure and is the first-line, non-pharmaceutical intervention [9]. Hypertension reshapes the heart, causing hypertrophy, irregular heart rhythms, and the initiation of the fibrosis, a precursor to cardiac arrhythmias and diastolic or systolic dysfunction [10]. Excess collagen in the heart muscle impairs relaxation and causes diastolic dysfunction; systolic dysfunction occurs as fibrosis impairs cardiomyocyte contraction [10]. Cardiac disease can compromise renal function, and it can result in neuroinflammation in the brain that may impair cerebral blood flow, allowing pro-inflammatory cytokines to damage pathways that are precursors for vascular dementia [10].
METHODOLOGY
Project Design
This DNP-translated quality improvement (QI) project used the Plan-Do-Study-Act (PDSA) cycle to evaluate the impact of a tailored intervention to improve sodium intake monitoring among Black American adults. The intervention used the My DASH Diet Sodium Tracker App, a smartphone app designed to track daily sodium intake over a 30-day period. The project was implemented in two predominantly Black churches, with n = 25 participants from church 1 and n = 5 from church 2. Use of the PDSA cycle enabled iterative refinement of the intervention and data collection procedures while supporting sustainable, data-driven quality improvement within a community setting [11].
Setting and Participants
The participants were selected from two small community churches in the northwest suburbs of Illinois. Prior to this project, both churches had been involved in community initiatives for Black Americans aimed at improving general outcomes. The participants from both churches were 18 years and older, with risk factors or a diagnosis of hypertension. All participants were English-speaking, volunteered for the project, owned smartphones, and agreed to download and use the My DASH Diet Sodium Tracker App independently during the project timeframe. The project did not include vulnerable populations or individuals from other ethnic backgrounds.
Intervention
The intervention began with an educational session that presented and emphasized the health risks of excessive sodium intake, the recommended daily limit of 1,500 mg, and instructions for using the My DASH Diet Sodium Tracker App. Participants were guided through the App installation and trained to log their sodium consumption. Weekly follow-up sessions were held on Zoom or communicated via online newsletters, aimed to reinforce the App use and provide culturally appropriate low-sodium menu planning guidance. Optional activities included scripture reading, box breathing, exercise, learning to eliminate fried foods, high-fat dairy, and sugars from the diet, as well as making healthy smoothies weekly, but these interventions were not statistically analyzed.
PDSA Cycle Implementation
- Plan: The problem of high sodium intake in the Black community was identified, and an intervention using a smartphone app was planned. Baseline data on participants’ knowledge and behaviors regarding sodium intake were collected via a pre-survey.
- Do: The intervention was implemented in June and July of 2025 in the fellowship hall area of both churches over a 30-day period. Participants used the My DASH Diet Sodium Tracker App to log their food and drink consumption. Weekly group meetings provided support and addressed barriers to the App usage.
- Study: Post-intervention surveys were administered to assess changes in awareness, behavior, and understanding of the dietary principles of limiting the daily sodium intake to 1,500 mg. My DASH Diet Sodium Tracker App snapshots were shared by some participants to verify monitoring behaviors and engagement.
- Act: Based on the project observations, the Principal Investigator (PI) refined the educational resources and the My DASH Sodium Tracker App instructional guide to enable translation of the project via a QR code (https://qrco.de/bg14D2). Feedback from church leaders, participants, and preceptors, along with supportive statistical results, was instrumental in the project's sustainability.
Data Collection and Analysis
The PI collected quantitative data via pre- and post-intervention surveys assessing knowledge and behaviors related to sodium intake. A paired sample t-test and correlation test were conducted to investigate whether a preset in sodium of 1,500 mg over 30 days was associated with a reduction of systolic blood pressure by at least 3–4 mm Hg. Information about My DASH Diet Sodium Tracker App intervention and participant engagement was also analyzed.
Target: BP™ national initiative was created by the AHA and American Medical Association (AMA) to support healthcare providers with free tools to improve efficiency in monitoring blood pressures and guiding individuals to use home automatic blood pressure monitors [17]. The PI received a validated certification from Target: BP™ prior to assessing the blood pressure of the participants. Blood pressure measurements were obtained with the calibrated Omron 10 automatic blood pressure cuff, which was manufactured by Omron Healthcare, Inc. [18].
Ethical Considerations
The PI received approval from the Institutional Review Board (IRB) before project implementation. The PI secured informed consent from all participants before the start of the project. To maintain participant confidentiality in accordance with IRB ethical standards, participants were instructed to create unique identification codes, which allowed for accurate comparison of their pre‑ and post‑intervention systolic blood pressure readings.
Intervention Protocol
The intervention protocol utilized the free download version of the My DASH Diet Sodium Tracker App, which allowed participants to track sodium by recording their daily consumed foods and drinks. The PI provided instructions and a demonstration on how to use the App (see Appendix A). The PI also assisted the participants with entering the preset sodium value of 1,500 mg in the App. The participants were encouraged to log their daily food and beverage consumption. Immediately after a food or drink was logged into the My DASH Diet Sodium Tracker App, the participants were able to see the sodium content calculation of each food or beverage as well as its comparison to the allowable sodium consumption for that specific day.
The My DASH Diet Sodium Tracker App uses color coding to indicate sodium levels: green (lowest sodium range), yellow (middle sodium range), and red (highest sodium range). Participants were encouraged to pre-plan meals and then enter the foods and beverages from each meal into the sodium tracker App before eating to adjust their food or beverage choices as necessary in order to keep their sodium near the daily goal of 1,500 mg. Participants were taught to purchase items containing less than 115 mg of sodium per serving. My DASH Diet Sodium Tracker App provides a visually interactive way to calculate sodium intake, allowing easy tracking so the user can see whether their next meal choice needs adjustment to meet their sodium consumption goal.
If the participants wanted to check the sodium levels of a food or drink item before purchase or ingestion, they could use the App’s deletion feature to remove the item from their pre-planned menu so that they could make a better dietary choice to maintain their daily sodium intake goal. Participants could also use the App to find lower-sodium options. Notifications to prompt users to log food into the App were limited. The participants were advised to add an alarm and to keep the App on the home screen as a reminder to log foods and drinks regularly.
The free version of the My DASH Diet Sodium Tracker App includes a learn feature that provides literature sources discussing why the DASH diet was created. The DASH diet was developed in 1997 and has been comprehensively studied in 100 randomized controlled trials to help prevent hypertension by promoting healthier food choices based on a list of recommended DASH foods [12]. The DASH diet focuses on foods rich in nutrients such as potassium, magnesium, and calcium, which help regulate blood pressure through the renin-angiotensin system. The participants received recommendations emphasizing eating vegetables (4-5 servings per day); fruits (4-5 servings per day); whole grains (6-8 servings per day); low-fat dairy (2-3 servings per day); lean proteins (6 or fewer servings per day; 1 oz cooked per serving); nuts, seeds, or legumes (4-5 servings per week or 1/2 cup cooked legumes per serving; 2 Tbsp or 0.5 oz seeds and 1/3 cup or 1.5 oz of nuts); and choosing healthy fats, such as olive, sunflower, or canola oils (staying within the total fat at 27% of daily calories and saturated fat at 6% of daily calories) in alignment with the DASH macronutrient targets (see Figure 9) [12].
The combination of utilizing educational videos, a sodium fact sheet from the AHA, low-sodium culturally influenced recipes, and adherence to the DASH dietary pattern has resulted in better cardiovascular health outcomes and improved control of hypertension in Black adults [13,14]. According to White et al. (2024), studies have demonstrated the effectiveness of the My DASH Diet Sodium Tracker App in helping Black individuals lower their blood pressure [13]. Participants were taught to interpret serving sizes as indicated on nutrition labels. The PI used interactive activities to review additional components of the nutrition facts label, including serving size, servings per container, calories, added sugars, sugars, protein, dietary fiber, carbohydrate, cholesterol, sodium, total fat, trans fat, saturated fat, vitamin D, calcium, iron, and potassium, to broaden participants' awareness.
The body benefits from healthy macronutrient choices and a sufficient intake of micronutrients [13]. Participants received additional guidance to create a shopping list to purchase more nutritious food and drinks. They were also instructed to choose menu items with the lowest sodium content when dining at restaurants or fast-food establishments. The participants were advised to maintain these behaviors to achieve the sodium-reduction goal. Connecting the benefits of sodium monitoring with My DASH Diet Sodium Tracker App and increasing awareness through education leads to behavioral change, promotes self-efficacy, and reduces hypertension disparities.
The PI assessed participants' readiness and translated evidence-based research into spiritual messaging to address behavioral change challenges that emerged during the 30-day project, thereby helping maintain participants' engagement. To honor the churches’ principles, the participants were encouraged to read the scriptures from the Bible daily; specifically, the following passage from 1 Corinthians 10:31 was emphasized: “Whether, therefore, ye eat, or drink, or whatsoever ye do, do it all to the glory of God” [16]. Scripture reading kept participants engaged in the project and supported the introduction of the Transtheoretical Model, currently known as the Stages of Change Model. The Stages of Change Model is a conscious series of steps each person undergoes before arriving at acceptance and taking action to improve behavior. The model includes the following stages: precontemplation, contemplation, preparation, action, and maintenance [15]. During the precontemplation stage, participants determined whether a lifestyle change was necessary or if they needed to make a change in their behavior to prevent hypertension [15]. In the contemplation stage, the participants associated a problem with a strong consideration of change or recognized the need for behavioral change. The preparation stage included hypertension prevention education and obtaining signed informed consent for the project. Participants in the action stage removed and discarded high-sodium foods from their cabinets and refrigerators [15].
Demographics
Responses from the pre-survey for the demographic variables were categorized as follows: gender (female and male), age (18-24, 25-34, 35-44, 45-54, 55-64, and 65 or higher), education level (high school diploma or GED, associate’s degree, bachelor’s degree, and master’s degree or higher), and annual household income (<$50,000, $50,000-$100,000, >$100,000, and the option to prefer not to say). The sample participants from both churches (N = 30) were Black and mostly female (90%); see results in Table 1. The participants were 18 years and older, with the largest proportions in the 45-54 (33.3%) and 65 or older (36.7%) age groups. Educational attainment was relatively evenly distributed across categories (26.7%), except for the associate’s degree category (20%). For annual household income, 11 participants selected “prefer not to say”; among the remaining participants, 26.7% indicated annual earnings greater than $100,000.
Table 1. Demographics characteristics of the participants in the project
|
Index |
Church 1 & Church 2 Combined (N = 30) (Church 1: n = 25, Church 2: n = 5) |
|
Gender |
|
|
Age Rage |
|
|
Education Level |
|
|
Annual Household Income |
|
RESULTS
In the pre-survey, participants were asked a series of dichotomous questions to assess their level of knowledge of hypertension and their experience with any preventative or reduction programs, resources, or tools (Figure 1). The questions in the survey included the following: “Have you ever been diagnosed with high blood pressure (hypertension)?”; “Do you take more than 4 high blood pressure medications?”; “Have you ever been diagnosed with low sodium (hyponatremia)?”; “How often do you consume unhealthy food and drinks?”; “Have you ever used a sodium intake tracker app before?”; and “Have you ever used the box breathing technique to help with your high blood pressure?” Prior to participating in the program, 53.3% of participants had a diagnosis of hypertension. Three participants reported taking 4 or more blood pressure medications. The food consumption question was the only question that did not require a yes or no response; response options included 1-2 times per week, 3-4 times per week, and 5+ times per week. For this question, 63.3% reported consuming unhealthy food and drinks only 1-2 times per week, and 30% consumed them 3-4 times per week. All participants reported that before the hypertension prevention project, they were not aware of any tracking devices for monitoring sodium intake.
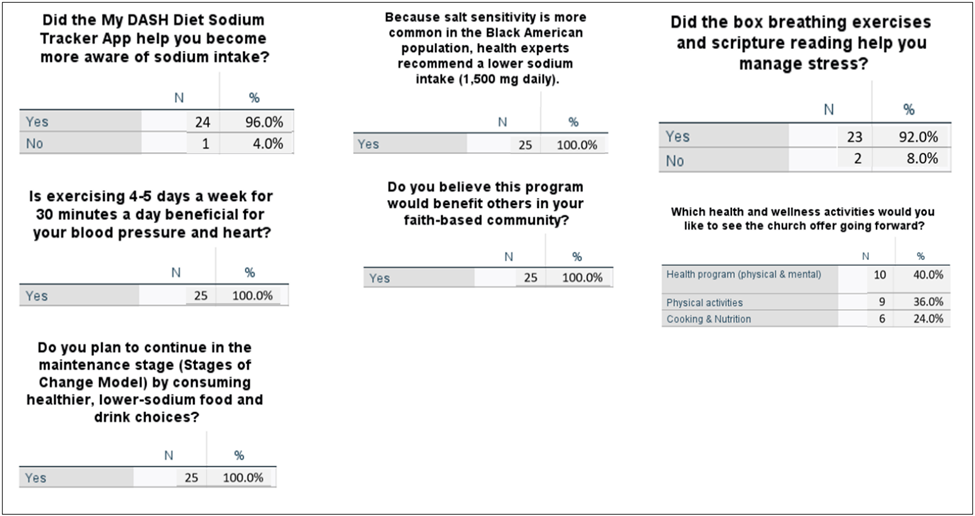
Twenty-five of the 30 participants who had completed the pre-survey went on to complete the post-survey (Figure 2). After the 30-day project, participants submitted post-surveys, in which one question inquired whether My DASH Diet Sodium Tracker App helped increase awareness of sodium intake, and 24 out of 25 participants responded “yes”. The positive responses correlated with the objective, which was to increase awareness of daily sodium consumption and to maintain it at 1,500 mg or less to prevent or control hypertension. All the participants reported that they had benefited from the knowledge obtained by using the My DASH Diet Sodium Tracker App. Each participant also indicated that the project would be beneficial in faith-based communities. Additionally, everyone reported that they would continue applying the concepts of the Stages of Change Model when it comes to following a low sodium diet.
Participants who consistently monitored sodium intake using the My DASH Diet Sodium Tracker App demonstrated greater reductions in systolic blood pressure compared to those who engaged in this intervention intermittently. The mean systolic blood pressure decreased by approximately 7 mm Hg among the dedicated and active users of the App. In the post-survey, 100% of participants reported gaining knowledge about box breathing techniques, and 92% indicated that box breathing helped reduce their stress during the 30 days.
Figure 1. Pre-Survey Results.
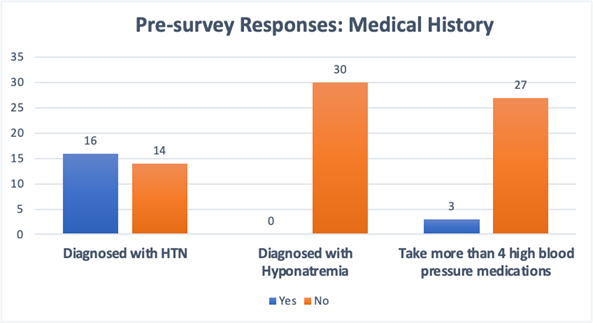
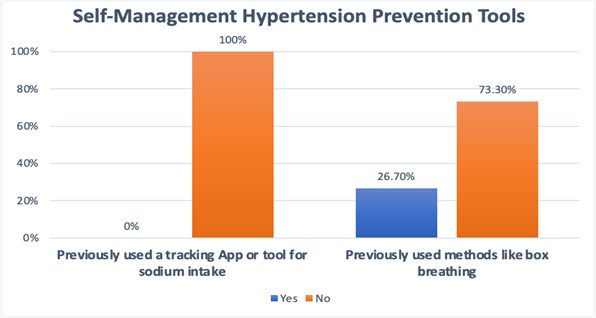
Figure 2. Post-Survey Results.
Hypothesis Assessment
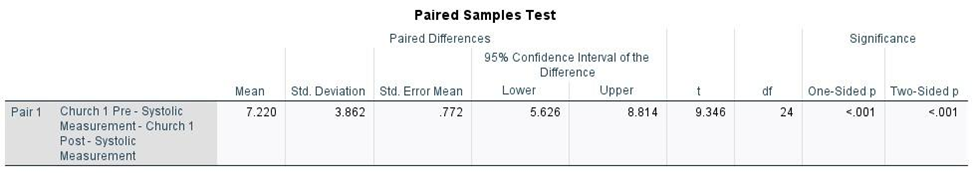
The null hypothesis stated that there is no difference between pre- and post-intervention systolic blood pressure measurements. The alternative hypothesis stated that the post-intervention systolic blood pressure is significantly lower than the pre-intervention systolic blood pressure. The alternative hypothesis was accepted, demonstrating that monitoring sodium intake by using the My DASH Diet Sodium Tracker App helped reduce blood pressure. For participants in church 1, a paired sample t-test was conducted to assess the significance of the change in systolic blood pressure measurements. On average, systolic blood pressure decreased by 7 mm Hg after the participants had successfully completed the health intervention project. The p-value derived from the test was <0.001, and the 95% confidence interval ranged from 5.262 to 8.814 (Figure 3). Both the p-value and confidence interval indicated that the reduction in systolic blood pressure was statistically significant.
Figure 3. Paired Sample T-Test Hypothesis Analysis for Church 1 to Assess Change in Systolic Blood Pressure Measurements.
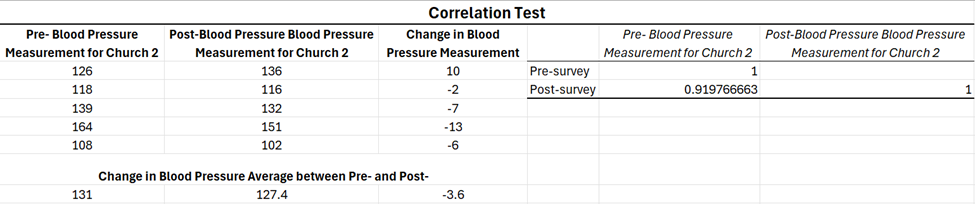
For church 2, a correlation test was conducted because the sample size was insufficient to perform a paired sample t-test. The purpose of the correlation analysis was to determine whether a relationship existed between participation in the health intervention project and improvements in the participants’ systolic blood pressure. If a relationship was identified, the analysis assessed both the direction (positive or negative) and the strength of the correlation. The correlation test yielded a coefficient of 0.9198, indicating a strong and positive correlation (Figure 4). The findings suggested that continued adherence to the health intervention guidelines was associated with improvements in systolic blood pressure. Church 2 achieved an overall mean systolic blood pressure reduction of 3.6 mm Hg. Participants in this group used My Dash Diet Sodium Tracker App minimally during a 30-day period. Extending the project by an additional 2 weeks allowed some participants to track their sodium intake more consistently, resulting in improved post-intervention systolic blood pressure measurements.
Figure 4. Correlation Test for Church 2 to Assess Change in Systolic Blood Pressure Levels.
DISCUSSION
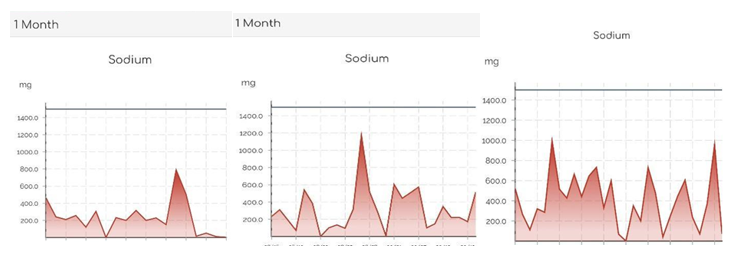
This project was associated with a clinically meaningful reduction of 7 mm Hg in systolic blood pressure, particularly among the participants who adhered to sodium tracking and the project’s educational components. In contrast, participants who followed the project intermittently experienced a 3 mm Hg reduction in systolic blood pressure. Most participants shared screenshots from the My DASH Diet Sodium Tracker App to visualize their sodium-tracking activity at the end of the 30-day project (Figure 5). The Stages of Change Model is an important element in facilitating behavior change, and each stage progression varies by the individual’s determination to change. The PI found that effective communication and innovative ways to promote change and increase engagement were critical to the project’s success. Overall, for this project to achieve greater generalization, a larger sample size and heterogeneity would be necessary. Requiring participants to submit their weekly sodium consumption records would have increased accountability. It is possible that group-sharing experiences would have provided another statistical representation of sodium-reduction trends.
Figure 5. Screenshot of the Display Image of the My DASH Diet Sodium Tracker App.
CONCLUSION
A team approach with larger research studies is required to address the multifactorial risks in the development of hypertension in Black Americans and to decrease hypertension in the United States. These studies can focus on one key modifiable risk factor—reducing sodium intake to 1,500 mg per day, which is effective in improving outcomes for people who consistently monitor their sodium intake. Limiting sodium intake to 1,500 mg per day can lower systolic blood pressure, reduce complications, and help mitigate hypertension disparities among Black Americans. Whether education is facilitated in a church or a physician's office, awareness and behavior change, combined with self-efficacy that advances progress through the Stages of Change, will enhance commitment. The emphasis on educating Black Americans to limit sodium intake to 1,500 mg, regardless of where they live, work, worship, or engage in daily activities, may help promote healthier eating and drinking habits.
ACKNOWLEDGMENT
I am grateful to God for the fervent and visionary leadership of the Black American pastors and the faithful participation of church members. My family believed in me and carried extra responsibilities at home while I focused on my studies. Dr. Ariri, my distinguished academic advisor and faculty chair, had faith in the project's success, introduced me to the Laerd Statistics refresher course to strengthen my understanding of statistical data analysis, and then I analyzed my data using SPSS. Serving as experts during my residency, Dr. Nandkumar (Dr. Weisberg) at Elk Grove Internist and Renee Spacapan DNP, APRN, FNP-BC (Nephrology Associates of Northern Illinois and Indiana) provided me with the opportunity to join their team to observe firsthand the intricacies behind the management of patients with chronic hypertensive heart disease with or without heart failure, diabetes, chronic kidney disease, and kidney failure; giving me a greater commitment to preset sodium in Black communities towards reducing health disparities in hypertension. Dr. T. Buckner and Dr. E. Rios, who oversaw the project's accuracy and ethical conduct, increased my confidence immensely through their innovative leadership. Blue Cross and Blue Shield of Illinois partnered with a northwest suburban church and, after my preceptor, Dr. E. Rios, shared the mission of my project, distributed blood pressure cuffs and sodium-free cookbooks to participants. The partnership did not influence the implementation of my project, its outcomes, or the final manuscript. The project manager, Mr. Z. Tobin of the My DASH Diet Sodium Tracker App, provided me with valuable insight into using the free version of the App.
CONFLICT OF INTEREST
I declare no conflict of interest in the project.
FUNDING
The cost of printing flyers and educational materials was funded from the PI's budget.
REFERENCES
- Zhou B, Carrillo-Larco RM, Danaei G, Riley LM, Paciorek CJ, Stevens GA, Ezzati M. (2021). Worldwide trends in hypertension prevalence and progress in treatment and control from 1990 to 2019: A pooled analysis of 1201 population-representative studies with 104 million participants. The Lancet. 398(10304):957-980. https://doi.org/10.1016/S0140-6736(21)01330-1
- World Health Organization. Massive efforts needed to reduce salt intake and protect lives. March 9, 2023. https://www.who.int/news/item/09-03-2023-massive-efforts-needed-to-reduce-salt-intake-and-protect-lives
- American Heart Association. Cardiovascular health risks continue to grow within Black communities; action is needed. February 07, 2025. https://newsroom.heart.org/news/cardiovascular-health-risks-continue-to-grow-within-black-communities-action-needed
- Ferdinand KC, Nasser SA. (2020). A review of hypertension management in Black male patients. Mayo Clin Proc. 95(10):2152-2160. https://doi.org/10.1016/j.mayocp.2020.05.042
- Maaliki D, Itani MM, Itani HA. (2022). Pathophysiology and genetics of salt-sensitive hypertension. Front Physiol. 13:1001434. https://doi.org/10.3389/fphys.2022.1001434
- Center for Disease Control and Prevention. Tips for reducing sodium intake. January 31, 2024. https://www.cdc.gov/salt/reduce-sodium-intake/index.html
- National Institute for African American Health. Reducing sodium intake for better health in the Black community. BLKMD. 2025. https://blkmd.com/reducing-sodium-intake-for-better-health-in-the-black-community/
- American Heart Association. High blood pressure among Blacks adults. AHA. https://www.heart.org/en/health-topics/high-blood-pressue/know-your-risk-factors-for-high-blood-pressure/high-blood-pressure-among-black-adults
- Svetkey LP, Simons-Morton D, Vollmer WM, Appel LJ, Conlin PR, Harsha DW. (1999). Effects of dietary patterns on blood pressure: Subgroup analysis of the Dietary Approaches to Stop Hypertension (DASH) randomized clinical trial. Arch Intern Med. 159(3):285-293. https://doi.org/10.1001/archinte.159.3.285
- Mavrogeni S, Markousis-Mavrogenis G, Kolovou G, Kitas GD. (2022). Cardiac involvement in autoimmune diseases: The role of cardiovascular magnetic resonance imaging. Front Cardiovasc Med. 9:982559. https://doi.org/10.3389/fcvm.2022.982559
- Institute for Healthcare Improvement. Science of improvement: Testing changes. IHI. 2023. https://www.ihi.org/resources/Pages/HowtoImprove/ScienceofImprovementTestingChanges.aspx
- National Heart, Lung, and Blood Institute. My DASH sodium tracker (Version 7.1.1) [Mobile app]. U.S. Department of Health & Human Services. https://www.nhlbi.nih.gov/education/dash-eating-plan/my-dash-sodium-tracker
- White BM, OoNorasak K, Sesay NA, Haskins D, Robinson CM. (2024). Economic and cultural assessment of the DASH eating plan for low-income African Americans: An integrative review. Int J Environ Res Public Health. 21(11):1480. https://doi.org/10.3390/ijerph21111480
- American Heart Association. Reducing sodium in the U.S. diet: Fact sheet. AHA. 2021. https://www.heart.org/-/media/Files/About-Us/Policy-Research/Fact-Sheets/Access-to-Healthy-Food/Reducing-Sodium-in-the-US-Diet-Fact-Sheet.pdf
- Prochaska JO, DiClemente CC. (1983). Stages and processes of self-change of smoking. Toward an integrative model of change. J Consult Clin Psychol. 51(3):390-395. https://doi.org/10.1037/0022-006X.51.3.390
- King James Bible. Official King James Bible Online. 2007. https://www.kingjamesbibleonline.org. (Original work published 1769). https://bmchealthservres.biomedcentral.com/articles/10.1186/s12913-019-4482-6
- American Heart Association & American Medical Association. Target: BP clinical practice guidelines. AHA. https://targetbp.org/guidelines/
- Omron Healthcare Co., Ltd. Omron 10 Series wireless upper arm blood pressure monitor (Model BP7450) instruction manual. Kyoto (JP): Omron Healthcare Co., Ltd.; 2019. Available from: https://omronhealthcare.com
Appendix
Figure 6. Participant Instructions for Downloading and Using the My DASH Diet Sodium Tracker App.
|
For iPhone and Android download the free version in the App store by typing in the name My DASH Diet Sodium Tracker App on your smart phone. Once downloaded, fill in the personal data. Directions download: For Android 1. Go to the Google Play Store on your Android device. 2. Use the search bar and type "My Dash Diet Sodium Tracker" or "My DASH". 3. Select the free App version, which is the one called "My Dash Diet: Low Sodium Track". 4. To download the App, tap Install. For iOS 1. Go to the App Store on your iPhone or iPad device. 2. Use the search bar and type "My Dash Diet Sodium Tracker". 3. Select the free App version, which is the one called "My Dash Diet: Low Sodium Track". 4. To download the App, tap Get or the cloud icon. Tap the My DASH Diet Sodium Tracker App on your phone. Look for three bars or a home icon in the upper right-hand corner, which takes you to various activities within the App. 1. Set a recurring alarm to remind yourself to add your food or drink to the My DASH Sodium Tracker. 2. Logging your food and drink consumption in your My DASH Diet Sodium Tracker every day is an expectation in this health promotion. 3. If you forget a day of logging your dietary consumption, your streak will reset to zero days of logging. You can return to the missed day and log/add your food consumption. Step 1: Open the App Step 2: Go to "Log Food" or "Daily Tracker" (Image 2) Look for a tab labeled "Log Food," "Daily Log," "Track Meals," or a similar option, depending on your app version. Step 3: Choose/tap the + sign at the bottom, or add an entry in the area that indicates Breakfast, Lunch, Dinner, Snacks Step 4: Search for the Food or Drink in the upper area of the App Tap the search bar and type the name of the item that best corresponds to the item you plan to eat (e.g., "grilled salmon," "kale salad," or "water"). Select the closest match from the search results. Step 5: Adjust the Serving Size Enter the amount you ate or drank and adjust the serving size if needed. The App will automatically show the amount of sodium (mg) in the food or drink you enter and calculate your remaining sodium for the day. Step 6: Tap "Add" or "Log" Hit/tap the "Add" to " breakfast, lunch, dinner, e.g. button to record the item in your daily tracker. Step 7: Repeat as needed throughout the day Continue logging all food and drink items throughout the day to stay on track and do your best to meet your 1,500 mg sodium goal. After the program, I encourage you to maintain a lower sodium intake, which benefits your heart and kidneys. Using your My DASH Diet Sodium Tracker App daily helps support the habit of monitoring what you eat and drink, as well as tracking sodium levels. Real-time feedback of the sodium content of foods or drinks. |
Figure 7. Log-Tracking Feature of the My DASH Diet Sodium Tracker App.
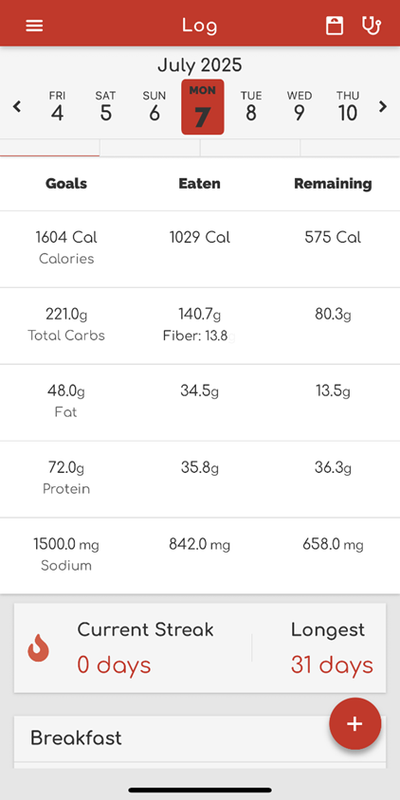
Figure 8.
Figure 9. DASH Eating Plan.
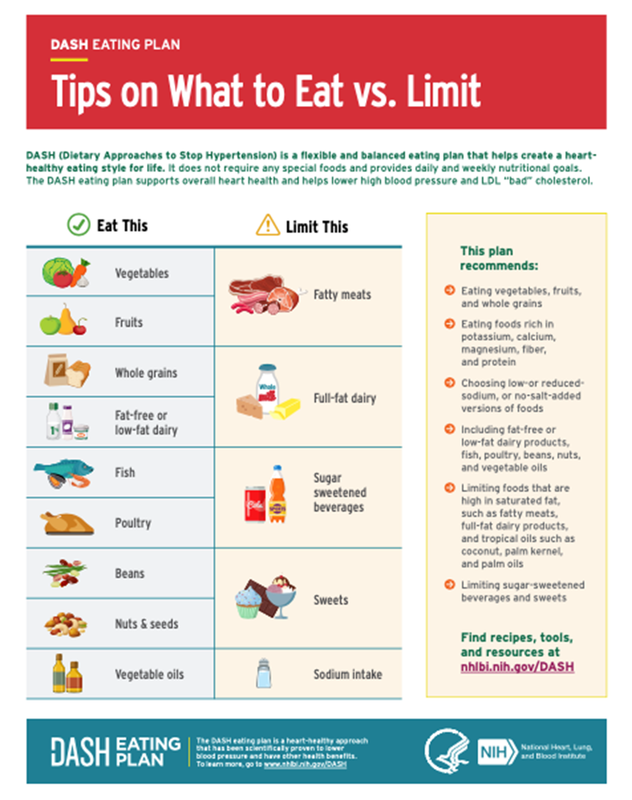
Figure 10. Institutional Review Board Letter.