Previous Issues Volume 4, Issue 1 - 2019
SEEG Depth Lead Records Inside an Air Bubble: A Case Report
Sheryl Manganaro1, Scellig Stone2
1Department of Neurology, Harvard University, USA.
2Department of Neurosurgery, Harvard University, USA
Corresponding Author: Sheryl Manganaro*, Department of Neurology, Harvard University, USA
Received Date: Mar 13, 2019
Published Date: Jun 14, 2019
Copyright © 2019 Manganaro S
Citation: Manganaro S. (2019). SEEG Depth Lead Records Inside an Air Bubble: A Case Report. Mathews J Neurol 4(1): 15.
ABSTRACT:
Intraoperative electrocorticography (ECOG) is performed during stereotactic EEG (SEEG) depth lead implantation in order to confirm the signal integrity of each individual contact on all depth leads. ECOG also allows for the analysis of brain activity and the ability to detect and eliminate extraneous signal interference in real-time. At Boston Children’s Hospital the Epilepsy Monitoring Unit (EMU) team of epileptologists and technologists work closely with the neurosurgeons and operating room staff during SEEG implantation procedures. During one invasive monitoring case our team encountered an unusually high amplitude fast rhythm on ECOG affecting one depth lead. Initially the signal appeared to be an extraneous artifact but on closer inspection a spread field involving other contacts on the same lead suggested a physiological source. Intra-operative CT imaging identified the source to be an air bubble-inadvertently trapped during implantation-that had surrounded the mid-section of the SEEG depth lead.
Keywords: Electrocorticography; Stereotactic EEG (SEEG); Intra-operative; Extraneous artifact.
CASE STUDY
At Boston children’s hospital, the Epilepsy Monitoring Unit (EMU) epileptologists and technologists routinely work as a team with the neurosurgeons and operating room staff when performing robot assisted intra-operative ECOG monitoring during SEEG depth lead implantation procedures. Clear communication among members of the intra-operative team helps avoid errors and reduce risk to the patient. In one case we recorded an unusually high amplitude, fast rhythm on ECOG localized to the F3d5 contact on the F3d depth lead. At first glance the signal appeared to be mechanical interference but on closer inspection we observed a field-of-spread from contact F3d5 to neighboring contacts F3d4 and F3d6 which suggested a physiological source (Figure 1).
We began trouble-shooting the ECOG computer and SEEG cables and connections but could not find the source or confirm damaged equipment. The case proceeded and eight total SEEG depth leads were implanted without incident. Routine intra-operative CT imaging was performed to confirm the accuracy of depth lead trajectories. In this case the CT images also revealed the source of the artifact to be a tiny air filled bubble that had become trapped during F3d lead implantation. The bubble surrounded the midpoint of the F3d lead enclosing F3d4, F3d5, and F3d6 contacts inside an air pocket (Figures 2 and 3).
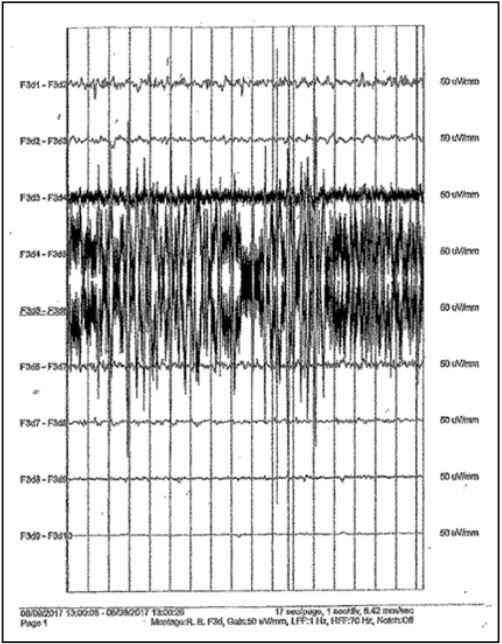
Figure 1: High amplitude activity appeared to localize to F3d5 but the fieldof-spread to neighboring contacts F3d4 and F3d6 suggested a physiologic source.
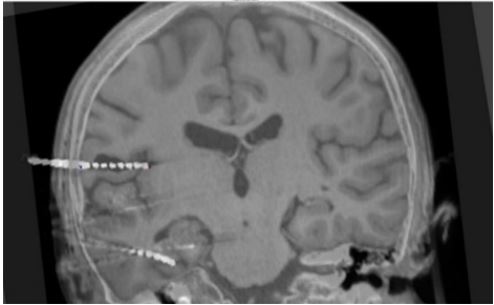
Figure 2: Coronal “trajectory” view along the F3d electrode (center left), with the intraoperative O-arm CT fused to pre-operative MRI. The air bubble (in black) surrounds the F3d depth lead at contacts F3d4, F3d5, and F3d6. Contact F3d5 is completely surrounded by air while F3d4 and F3d6 can be seen touching areas of brain tissue.
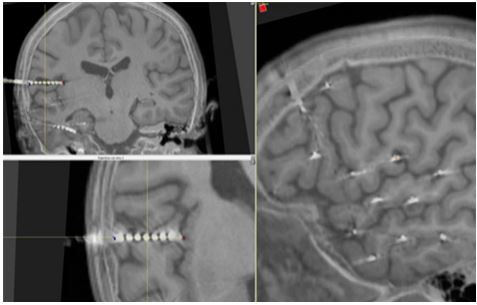
Figure 3: MRI images of the F3d depth lead with contacts F3d4, F3d5, and F3d6 in a “probe’s eye” view. Yellow lines intersect contact F3d5 and show the plane (left). A red-cross shows contact F3d5 at that same point (right). There is some metal related interference but an air pocket can clearly be seen surrounding the midpoint of the F3d depth lead.
We noted that over the course of ECOG monitoring the artifact was slowly decreasing in amplitude - a finding the attending neurosurgeon concluded was relative to the air bubble’s reabsorption rate. In just over an hour contacts F3d4, F3d5, and F3d6 began recording brain activity (Figure 4) and ECOG data continued to improve over the next several hours.
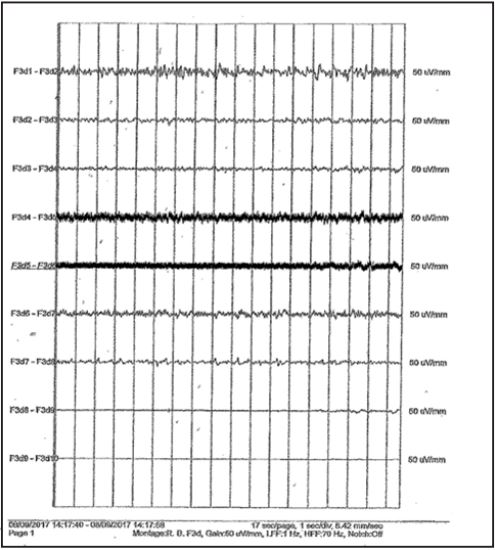
Figure 4: ECOG of F3d after one hour of recording. Although the artifact remained significant on contact F3d5 the amplitude has greatly decreased and the field-of-spread to contacts F3d4 and F3d6 has almost resolved. ECOG data from the F3d depth lead continued to clear and improve over time.
CONCLUSION
The importance of good quality intra-operative ECOG performed by an experienced invasive monitoring team and the effective application of trouble-shooting strategies for the purpose of differentiating between brain activity and extraneous signal interference in real-time is imperative particularly when novel situations arise. A strong, communicative intra-operative team can help reduce patient risks and the costs associated with removing and re-implanting suspected damaged depth leads which require extending anesthesia and O.R. time and repeating intra-operative CT imaging.