Information Links
Related Conferences
Previous Issues Volume 7, Issue 1 - 2023
Pheromone Trap Catch of Fruit Pest Moths Influenced by the Geomagnetic Disturbance Storm Time (Dst)
Nowinszky László1,*, János Puskás1, Hill Lionel2, Miklós Kiss1, Barczikay Gábor2
1Eötvös Loránd University, Savaria University Centre, Károlyi Gáspár Square 4, H-9700-Szombathely, Hungary
2Principal Entomologist at Biosecurity Tasmania, Australia
*Corresponding author: Nowinszky László, Eötvös Loránd University, Savaria University Centre, Károlyi Gáspár Square 4, H-9700-Szombathely, Hungary; E-mail: [email protected].
Received Date: January 31, 2023
Published Date: February 21, 2023
Citation: Nowinszky L, et al. (2023). Pheromone Trap Catch of Fruit Pest Moths Influenced by the Geomagnetic Disturbance Storm Time (Dst). Mathews J Vet Sci. 7(1):19.
Copyrights: Nowinszky L, et al. © (2023).
ABSTRACT
This study reports the connection between the geomagnetic Disturbance Storm Time (Dst) and the catches of seven harmful moth species in pheromone traps. The collections occurred between 1982 and 2013, mostly using two traps per species. The captured moths were counted every morning.
A relationship was found between the values of geomagnetic Disturbance Storm Time (Dst) and the number of trapped moths for all species but the relationships varied. Three types were identified, namely increasing, increasing then decreasing and decreasing then increasing.
Keywords: Disturbance Storm Time, Pheromone Traps, Moths.
INTRODUCTION
Pheromone traps have been frequently used in the forecasting of insect pests. For plant protection forecasting, it is usually sufficient that the catches are not counted at 2-3 day intervals [1]. Examples of reliance on such frequency are many as follows.
Ghobari et al. [2] counted trapped Tortrix viridana L. moths every second day in Iran. González-Caberra et al. [3] counted trapped Tuta absoluta (Meyrick) moths twice a week. And changed the pheromone dispensers once a month. Abbes and Chermiti [4] recorded the number of captured Tuta absoluta moths weekly while changing the sticky cardboards. They renewed the pheromone dispensers monthly. Hielscher and Engelmann [5] counted and removed Black Arches (Lymantria monacha L.) moths from their pheromone trap every third day. Ágoston and Fazekas [6] checked their traps twice a week initially during the growth of tomatoes and then weekly after harvest until the end of November. Hári [7] counted fruit moths twice a week and replaced dispensers every 4-6 weeks. The sticky sheets were renewed when saturation or contamination made it necessary. Sípos [8] counted the Raspberry Cane Midge (Resseliella theobaldi Barnes) moths in pheromone traps and changed the sticky sheets weekly. She renewed the pheromone dispensers monthly.
However, if the number of captured individuals is not counted daily then it becomes impossible to recognize the effect of factors that change daily (eg. temperature, precipitation, wind etc.). According to Pénzes et al. [9] the sex pheromone traps can be used effectively for forecasting if the collected insects are daily counted. Examples of reliance on daily frequency are many as follows.
Nasseh and Moharam [10] changed the water and detergent in their pheromone traps daily and counted the African Armyworm (Spodoptera exempta Walker) moths daily. They changed the pheromone dispenser capsules every three weeks. Giri et al. [11] in a pheromone trap every morning between 6 and 8 a.m. in Nepal. Byers [12] observed by sampling pheromone traps throughout the night that male flight of date moth Batrachedra amydraula began at 1:00–2:00 and reached a peak 2 hours before sunrise. Levi-Zada et al. [13] used pheromone traps in a date plantation for 24 hours and captures were recorded every hour throughout the night (00:00–08:00 AM) and every 2 hours during the rest of the day for four days.
Geomagnetic field intensity can be used by some animals to determine their position during migration. A recent study [14] found that findings indicate changes in GMF intensity can alter the expression of phenotypes critical for insect migration and highlight the unique role of magnetoreception as a trait that may help migratory insects express potentially beneficial phenotypes in geographically variable environments.
The geomagnetic field has been found [15] to be an important source of directional information for animals (including Nilaparvata lugens Stål, 1854), but the relevant magnetic compass has not yet been fully identified. They found that the near-zero magnetic field or vertical reversal of geomagnetic field could lead to Brown Planthopper (Nilaparvata lugens) losing the foraging orientation preference, suggesting that a normal level of GMF, in the way of either intensity or inclination, was essential for the foraging orientation of Brown Planthopper.
Worldwide, counting per day is extremely rare and it is usually conducted at 3-7 day intervals [16 and 17]. We had daily pheromone trap catch data for several pests in Hungary from 1982 to 2013. This copious daily catch data made it possible to examine the influence of environmental and biotic factors. Therefore, we published our research results in a book in connection with environmental factors such as temperature, air pollutants, weather fronts, polarized moonlight, ozone, height of the tropopause, ultraviolet B radiation, geomagnetic G9 index and the solar Q index [18].
Our recent study [19] deals with geomagnetic Disturbance Storm Time (Dst) in relation with the light-trap catch of eight caddisfly (Trichoptera) species. For each species, a relationship was found between the Dst index and the number of caddisflies captured. However, the results were not identical. Three types of variation were identified: ascending, descending and ascending then descending.
The aim of our current work was to determine whether another solar factor, the geomagnetic disturbance storm time, affects the pheromone trap catching of moths.
MATERIAL
The Dst (Disturbance Storm Time) index has been used since 1957/58. It characterizes the earthly manifestations of space weather by measuring the strength of the ring current around the Earth, which is created by protons and electrons originating from the Sun.
Large disturbances of the Earth's magnetic field, the so called geomagnetic storms, are defined by changes in the Dst (Disturbance Storm Time) index. The Dst index determine the globally averaged change of the horizontal component of the Earth's magnetic field at the magnetic equator. The Dst index is calculated hourly by using measurements from a few stations at low latitudes (Honolulu, San Juan, Hermanus, and Kakioka). The size of a geomagnetic storm is classified as moderate (−50 nT > minimum of Dst > −100 nT), intense (−100 nT > minimum Dst > −250 nT) or super-storm (minimum of Dst < −250 nT). During quiet times the Dst is between +20 and −20 nanoTesla (nT). We used the data of hourly equatorial Dst values (Final) published by WDC Kyoto Observatory.
Biologist Gábor Barczikay operated pheromone traps between 1982 and 1990 in nine villages in the orchards of Borsod-Abaúj-Zemplén county of Hungary. An additional two traps operated between 1993 and 2013. The pheromone traps operated in villages and towns as listed in Table 2. 1. The catch data of the collected species is given in Table 2. 2.
Most but not all seven species were trapped in every year by two traps at each of two locations (2-2 traps). Traps were spaced about 50 metres apart. In these cases, there was 2-2 monitoring data for each day. The traps were always hung on leafy branches of the same tree or leafy vines usually 1.5 to 2 metres above the ground. The distance of a pheromone trap from fruit trees determines the number of moths caught. We found that a trap located 25 metres from a plum-tree collected many Plum Fruit Moth (Grapholita funebrana Tr.) specimens while another trap, located 150 metres from the same tree started to catch moths only days after the first one and collected few specimens. After moving the second trap closer to the tree, the catch of the two traps became nearly equal [19]. The traps worked from early April to late September. Capsules dispensing the pheromone were renewed at 6-8 week intervals in accord with the [1] proposal.
The various pheromone traps collected seven species of pest moths and the number of captured moths was recorded daily.
Table 2. The pheromone traps were operated in Borsod-Abaúj-Zemplén County.
|
Villages (Towns) |
Years |
Longitude |
Latitude |
|
Bodrogkisfalud |
1982−1983 1993−2013 |
48°10'41'' |
21°21'77'' |
|
Bodrogkeresztúr |
1988 |
48°09'54'' |
21°21'64'' |
|
Bodrogszegi |
1982−1983 |
48°26'82'' |
21°35'61'' |
|
Erdőbénye |
1987−1988 |
48°15'91'' |
21°21'18'' |
|
Erdőbénye-Meszesmajor |
1988 |
48°11'43'' |
21°22'46'' |
|
Mád |
1987−1988 |
48°11'55'' |
21°16'70'' |
|
Sátoraljaújhely |
1988 |
48°23'80'' |
21°39'34'' |
|
Tolcsva |
1988 |
48°17'05'' |
21°27'02'' |
|
Tokaj |
1990 |
48°06'75'' |
21°'24'75'' |
Table 2. The number and observing data of the examined species.
|
Species |
Number of |
|
|
Moths |
Data |
|
|
Gracillariidae, Lithocolletinae |
||
|
Spotted Tentiform Leafminer Phyllonorycter blancardella Fabricius, 1781 |
83,338 |
3,552 |
|
Hawthorn Red Midget Moth Phyllonorycter corylifoliella Hübner, 1796 |
10,202 |
1,702 |
|
Gelechiidae, Anacampsinae |
||
|
Peach Twig Borer Anarsia lineatella Zeller, 1839 |
14,714 |
3,571 |
|
Tortricidae, Olethreutinae |
||
|
European Vine Moth Lobesia botrana Denis et Schiffermüller, 1775 |
33,564 |
4,097 |
|
Codling Moth Cydia pomonella Linnaeus, 1758 |
16,079 |
3,836 |
|
Oriental Fruit Moth Grapholita molesta Busck, 1916 |
26,868 |
4,372 |
|
Plum Fruit Moth Grapholita funebrana Treitschke, 1835 |
53,496 |
5,298 |
Basic data were the number of individuals of each species caught in one night. In order to compare the differing sampling data, relative values were calculated. The relative catch value (RC) was defined as the quotient of the number of specimen caught during a sampling time unit (1 night) per the average nightly catch of individuals within the relevant sampling period. The RC was one when the actual nightly catch was equal to the average nightly catch across the whole trapping period [20].
The number of these classes was calculated following the method of Sturges [21] by use of the following formula:
k = 1 + 3.3 * 1g n
Where: k = the number of classes, n = the number of observation data.
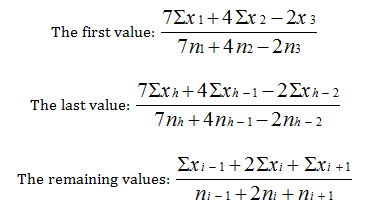
It is not reasonable to have big differences in the number of data across classes. Therefore, the classes at the two extremities are wider than those in the middle. Within each class we used our own method and calculated three point weighted moving averages from the values of the dependent variable. In previous work we found a problem about moving averaging in that the first and last values, the ones carrying in many cases valuable information on the most important biological impacts, were lost. In elaborating our method, we considered the work of Urmancev [22] pained by a moving average value. The new method also assigns differing weights the middle, previous and following values. Thanks to this method, our moving averages get weighted with the number of initial data. The 3 point, weighted moving average is calculated on the basis of the following formula:
The use of moving averages is justified whenever the independent variable is made up of data representing a wide range of values that are to be contracted into classes. The dividing line between these classes is always drawn more or less arbitrarily. In addition, the extreme values in two neighbouring classes of the independent variable are always closer to each other than they are to the middle value of their own class. Moving averages ensure a degree of continuity between the data of our arbitrarily established classes and, at least in part, eliminates the disturbing influence of other environmental factors not examined in the given context [20]. In this work, we chose a slightly different solution. Separately, all catch data by species were considered as a single sample and thus relative catch values were calculated. This solution also made it possible to determine the effectiveness of trapping from the relative catch values of each year and to compare the effectiveness of the years.
Finally, we averaged within groups the Dst index and relative catch data pairs. The results are plotted in the figures with the confidence intervals.
RESULTS AND DISCUSSION
Our results are shown in Figures 1 to 7.
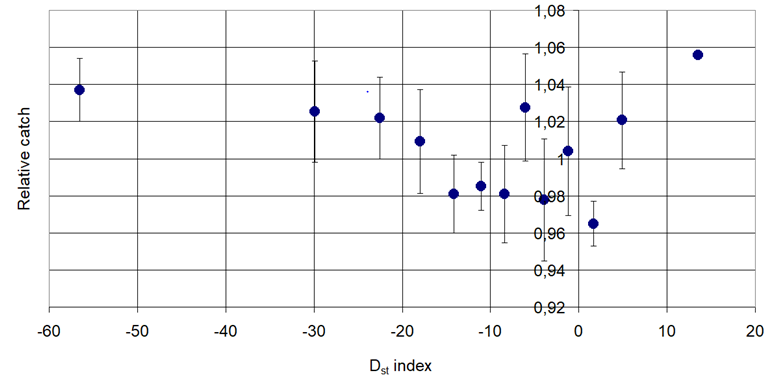
Figure 1. Pheromone trap catch of Twig Borer Moth (Phyllonorycter blancardella Fabricius, 1781) in connection with the Disturbance Storm Time (Dst).
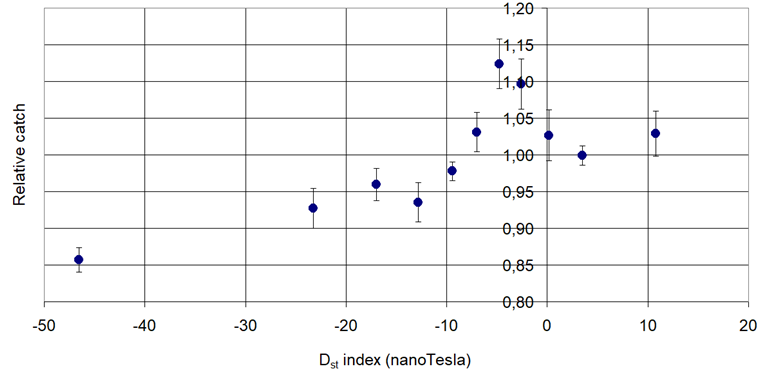
Figure 2. Pheromone trap catch of Hawthorn Red Midget Moth (Phyllonorycter corylifoliella Hubner, 1796) in connection with the Disturbance Storm Time (Dst).
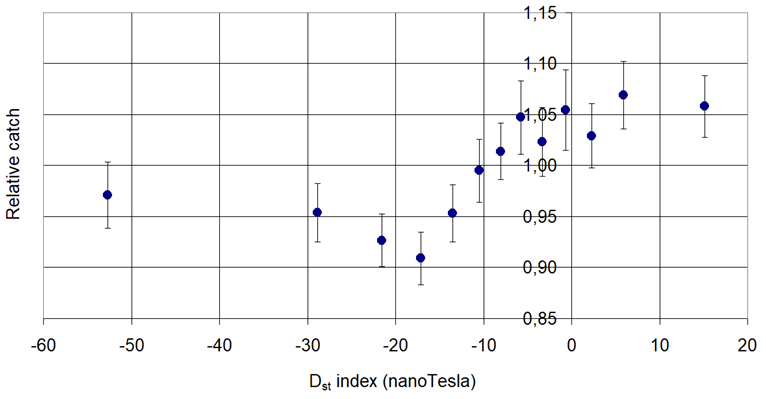
Figure 3. Pheromone trap catch of Peach Twig Borer (Anarsia lineatella Zeller, 1839) in connection with the Disturbance Storm Time (Dst).
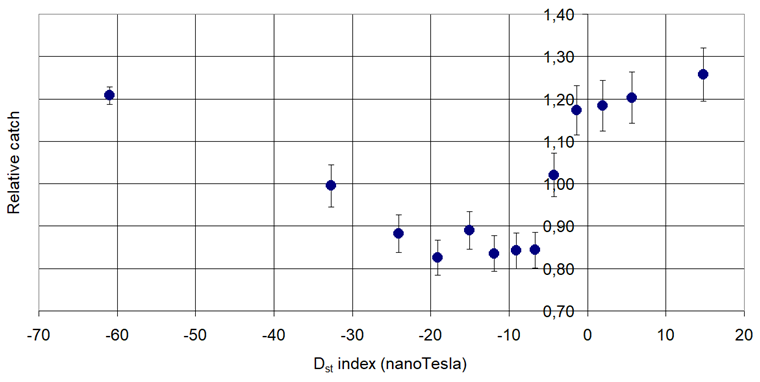
Figure 4. Pheromone trap catch of European Vine Moth (Lobesia botrana Denis & Schiffermuller, 1771) in connection with the Disturbance Storm Time (Dst).
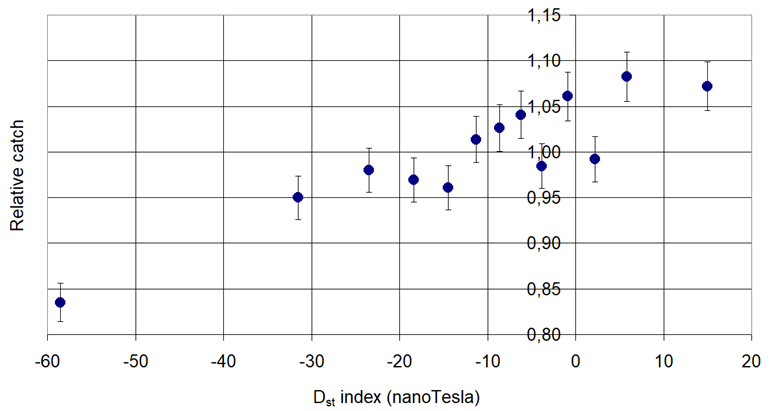
Figure 5. Pheromone trap catch of Codling Moth (Cydia pomonella Linnaeus, 1758) in connection with the Disturbance Storm Time (Dst).
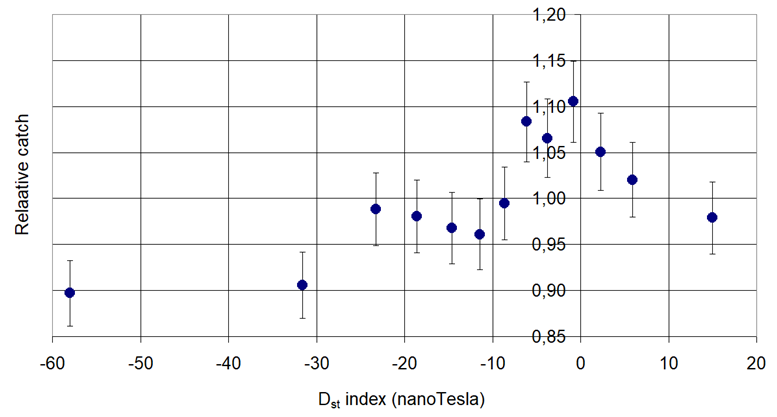
Figure 6. Pheromone trap catch of Oriental Fruit Moth (Grapholita molesta Busck, 1916) in connection with the Disturbance Storm Time (Dst).
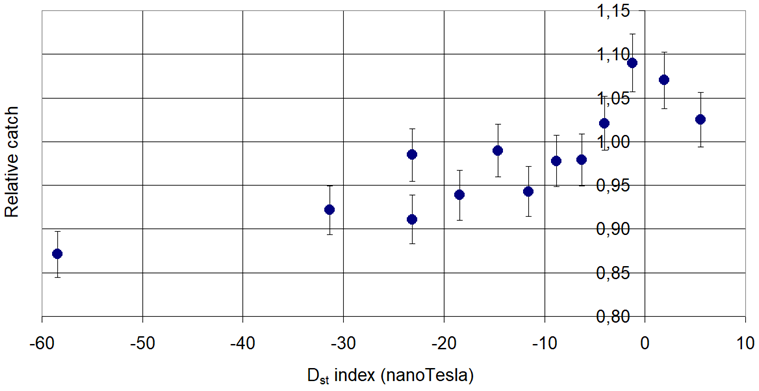
Figure 7. Phermone trap catch of Plum Fruit Moth (Grapholita funebrana Treitschke, 1835) in connection with the Disturbance Storm.
These results prove that moths can be classified into three behaviour types:
Increasing: Cydia pomonella L. and Grapholita funebrana Tr.
Increasing then decreasing: Phyllonorycter corylifoliella Hbn. and Grapholita molesta Busck,
Decreasing then increasing: Phyllonorycter blancardella Fabr., Anarsia lineatella Zeller and Lobesia botrana Den. et Schiff.
According to our hypothesis, the explanation of our results can be the following:
The increase or decrease of the catch is explainable by our previous hypotheses [20]. The variable flight response has many reasons. Species differ in their tolerance of environmental factors, which interact with each other to exert their effects so that a particular factor can have different effects at different times. The individuals of any species have different survival strategies. Adverse effects elicit two possible responses: passivity or increased activity because such behaviour ensures the survival of the species. Insects can hide or attempt "to carry out their duties in a hurry".
The low relative catch values always refer to situations in which the flight activity of insects diminishes but high values are not so simply interpreted. In our hypothesis, an individual has two options for evading the impacts that hinder the normal functioning of its life phenomena. It may either display more liveliness, by increasing the intensity of its flight, copulation and oviposition or take refuge in passivity to weather an unfavorable situation. Hence, by the present state of our knowledge, we might say that favorable and unfavorable environmental effects might equally be accompanied by a high catch [20].
The explanation for the increasing type is that even moderate values of geomagnetic storm (Dst) are unfavorable for these species.
The explanation of the increasing and then decreasing type, according to our hypothesis, may be as follows. Initially, some environmental factor enhances insect activity, whether favorable or unfavorable to the state of the environment. However, a stronger effect subsequently forces it into passivity.
The decreasing and then increasing type is harder to explain. We must assume that not all individuals of the same species behave identically. According to our hypothesis, the activity of a part of the population increases during geomagnetic storm moderate values, while other individuals of the population increase activity during quiet times. It can be assumed that this mode of behavior ensures the survival of the population even in highly unfavorable situations. This phenomenon may be similar to the sensitivity to hot and cold fronts observed in humans.
However, it is striking these types of responses by species are independent of the continent and taxonomic classification.
CONCLUSIONS
According to our results, changes in the geomagnetic field modify the effectiveness of pheromone trapping of moths: Based on the responses of the butterflies, we defined three types of behaviour: increasing, increasing then decreasing and decreasing then increasing. The different behaviour helps the survival of the population and is not related to the systematic situation of the species.
REFERENCES
- Tóth M. (2003). Pheromones and their practical application. In: Jenser G. (ed.): Integrated crop protection from pests (in Hungarian). Mezőgazda Kiadó, Budapest, Hungary. p. 21-50.
- Ghobari H, Goldansaz SH, Askari H. (2007). Investigation of some effective factors in the efficiency of pheromone traps of oak leaf roller moth Tortrix viridana L. (Lep.: Tortricidae) in Kurdistan Province. J Sci & Technol Agric & Natur Resourc. 13:47(A). Spring, Isf Univ Technol Isf, Iran. p. 263.
- González-Caberra J, Mollá O, Montón H, Urbaneja A. (2011). Efficacy of Bacillus thuringiensis (Berliner) in controlling the tomato borer, Tuta absoluta (Meyrick) (Lepidoptera: Gelechiidae) BioControl (2011) 56:71-80. DOI 10.1007/s10526-010-9310-1.
- Abbes K, Chermiti B. (2011). Comparison of two marks of sex pheromone dispensers commercialized in Tunisia for their efficiency to monitor and to control by mass-trapping Tuta absoluta under greenhouses. Tunisian Journal of Plant Protection. 6(2):133-148.
- Hielscher K, Engelmann A. (2012). Operational monitoring of the nun moth Lymantria monacha L. (Lepidoptera: Lymantriidae) using pheromone-baited traps–a rationalization proposal. Journal of Forest Science. 58(5):225-233.
- Ágoston J, Fazekas I. (2014). Recent data on the distribution and biology of Tuta absoluta (Meyrick, 1917) in Hungary (Lepidoptera: Gelechiidae) (in Hungarian). e-Acta Naturalia Pannonica. 7:5-14.
- Hári K. (2014). Hungarian options for developing of environmentally friendly plant protection of fruit moths (in Hungarian). PhD Dissertation. Corvinus University Budapest. p. 107.
- Sípos K. (2012). The swarming dynamics, daily activity, the possibility of the development of forecasting methods of the Raspberry Cane Midge (Reselliella theobaldi Barnes) (in Hungarian). PhD Dissertation. Corvinus University Budapest. p. 103.
- Pénzes B, Hári K, Láng Z, Medveczky E. (2010). Swarming phenology of first moths by signal transmission pheromone traps (in Hungarian) Plant Protecting Scientific Days. 56-Budapest, 5.
- Nasseh OM, Moharam IA. (1991). Forecasting of outbreaks of Spodoptera exempta Wlk. (Lep., Noctuidae based on sex-pheromone trapping in the Republic of Yemen. Anzeiger Schedlingskde, Pflanzenschutz, Umweltschutz. 64:93-96.
- Giri YP, Thapa RB, Dangi N, Aryal S, Shrestha SM, Pradhan SB, Sporleder M. (2014): Distribution and seasonal abundance of Potato Tuber Moth: Phthorimaea operculella (Zeller) (Lepidoptera: Gelechiidae) in Nepal. International Journal of Applied Sciences and Biology. 2(3):270-274.
- Byers JA. (2017). Monitoring and mass-trapping methodologies using pheromones: the lesser date moth Batrachedra amydraula. Bulletin of Entomological Research. 108(1):58-68.
- Levi-Zada A, Sadowsky A, Dobrinin S, Ticuchinski T, David M, Fefer D, et al. (2018). Monitoring and mass-trapping methodologies using pheromones: the lesser date moth Batrachedra amydraula. Bull Entomol Res. 108(1):58-68.
- Wan G, Liu R, Li C, He J, Pan W, Sword GA, et al. (2020). Change in geomagnetic field intensity alters migration associated traits in a migratory insect. Biol Lett. 16(4):20190940.
- Zhang Y, Pan W Peer J. (2021).Removal or component reversal of local geomagnetic field affects foraging orientation preference in migratory insect brown planthopper Nilaparvata lugens. PeerJ. 9:e12351.
- Nowinszky L, Puskás J. (2016). Pheromone Trap Catch of the Microlepidoptera Species in Connection with the Environmental Effects. Acta Naturalia Pannonica. p. 116.
- Nowinszky L, Barczikay G, Puskás J. (2010). The relationship between lunar phases and the number of pest Microlepidoptera specimens caught by pheromone traps. Asian J Exp Biol Sci. 1(1):14-19.
- Nowinszky L, Kiss M, Puskás J. (2018). Light-and Pheromone Trap Catch of Insects. GLOBE. p. 118.
- Nowinszky L, Kiss O, Puskás J, Kiss M, Barta V, Szentkirályi F. (2021). Effect of the Geomagnetic Disturbance Storm Time (Dst) on Light Trapped Caddisfly (Trichoptera) Species. Acta Scientific Microbiology. 4(8):11-16.
- Nowinszky L. (2003). The Handbook of Light Trapping. Savaria University Press, Hungary. p. 276.
- Odor P, Iglói L. (1987). An introduction to the sport's biometry (in Hungarian). ÁISH Tudományos Tanácsának Kiadása. Budapest, Hungary. p. 267.
- Urmancev JA. (1967). On the statistical necessity of biological objects (In Russian). Fiziologiya Rasteniy. 14(2):342‑358.