Information Links
Related Conferences
Previous Issues Volume 8, Issue 1 - 2023
Function Evaluation of Diabetic Vitreous Hemorrhage after Vitrectomy
Mona Abdelkader1,*, Maha M Shahin1, Omnia L Nwara2, Amr M Abdelkader3
1Professor of Ophthalmology, Faculty of Medicine-Mansoura University, Egypt
2Resident in Damietta Ophthalmology Hospital, Faculty of Medicine-Mansoura University, Egypt
3Lecturer of Ophthalmology, Faculty of Medicine-Mansoura University, Egypt
*Corresponding author: Mona Abdel-Kader, MD, Ophthalmology Center, Faculty of Medicine, Mansoura University, Mansoura, Egypt, Tel: 002-050-2216440, Fax: 002-050-2256104; E-mail: [email protected].
Received Date: January 12, 2023
Published Date: February 15, 2023
Citation: Abdelkader M, et al. (2023). Function Evaluation of Diabetic Vitreous Hemorrhage after Vitrectomy. Mathews J Ophthalmol. 8(1):31.
Copyrights: Abdelkader M, et al. © (2023).
ABSTRACT
Purpose: The aim of this study is to evaluate electrophysiological changes before and after pars plana vitrectomy for diabetic vitreous hemorrhage. Subject & Method: This study included 30 eyes of 30 patients with diabetic vitreous hemorrhage undergoing pars plana vitrectomy. All subjects underwent complete ophthalmological examination, Ultrasonography, Visual evoked potential, Electroretinography before and after vitrectomy (at 1 week & 3 months). Results: There was a statistically significant improvement in the Uncorrected Visual Acuity (UCVA) and the Best Corrected Visual Acuity (BCVA) along the study period (p <0.001). There was statistically significant improvement in the mean latency and mean amplitude of Flash VEP There was a statistically significant increase in the mean amplitude of all ERG parameters at 3 months postoperative. Conclusion: Electrophysiological test is an important tool in detection improvement of retinal function after vitrectomy.
INTRODUCTION
Diabetic vitreous hemorrhage is a cause of severe visual loss in diabetic patients. Pars plana vitrectomy with endolaser pan retinal photocoagulation remains the procedure of choice for non-clearing vitreous hemorrhage [1]. However, removing the vitreous body has considerable consequences for eye physiology. Oxygen transport and local availability of growth factor may both be altered [2]. The electroretinogram (ERG) reflects the summed electrical activity of the retina. Full-field electroretinography evaluates global retinal function, while multifocal ERG (mf-ERG) provides a topographic measure of retinal electrophysiological activity [3]. Visual evoked potential (VEP) is an electrical signal generated by the occipital cortex in response to light stimulation of the retina. The importance of the VEP is the diagnosis of optic nerve diseases and other ocular diseases [4]. The aim of this study is to evaluate electrophysiological (ERG, mf-ERG, VEP) changes before and after pars plana vitrectomy for diabetic vitreous hemorrhage.
SUBJECT & METHOD
This prospective study included 30 eyes of 30 patients with diabetic vitreous hemorrhage undergoing pars plana vitrectomy attending the Outpatient Clinic of Mansoura Ophthalmic Center during the period from January 2018 to September 2020. The following were excluded: Vascular occlusive disorders. Bleeding coagulopathies, Tractional retinal detachment.
Patients were informed verbally and in writing of the potential risks and benefits, and those who agreed to participate signed a written informed consent form.
All patients underwent complete ophthalmic evaluation using slit lamp biomicoscopy with special reference to lens status, intraocular tension and retinal status, Ultrasonography, Visual evoked potential.
ELECTRORETINOGRAPHY
Technique of Electroretinography (ERG)
Full field ERG was recorded using Ronald Consult (Ronald Consult, Electrophysiologische Diagnostik Systeme, Brandenburg, Germany).
ERG, mf-ERG were performed according to ISCEV 2015 guidelines [5]. Pupils were fully dilated (>7mm) using 1% tropicamide and 2.5% phenylephrine. Before placing electrodes, the skin was cleaned. Topical corneal anesthesia (Benoxinate hydrochloride 4%) was instilled and a Dawson, Trick and Litzkow (DTL) electrode (positive electrode) was placed contacting corneal limbus, a ground electrode was placed on the forehead and a negative electrode was placed near the orbital rim. The electrodes were placed under dim red light and after dark adaptation for 20 minutes. The recording was monocular and the contralateral eye was occluded with light pressure to suppress blinking. Prior to beginning the patients had to be in a comfortable body position, the head was still before stimulation and the eyes fixated on red light within the Ganzfeld globe. Subsequently the test was started and recorded.
Technique of VEP
Standard silver chloride electrodes of 1cm diameter were used for recording. Active (positive) electrode was connected to midline of head two finger breadth above inion (projection at backhead). Ground electrode was connected in midline of head at level of ear lobule. Negative electrode was connected to middle of forehead. The sites of electrode were cleaned with cleaning cream before putting the electrodes. The electrodes (silver, cup-shaped) were filled with connecting gel before putting in their sites. Impedance was kept below (10 K). For each eye two recordings were obtained. Participants were made to sit in a chair comfortably with chin in headrest to avoid muscle artifacts. The room was dimly lit with ambient light. White stimulus was given through xenon light kept at a distance of 30cm, at 2Hz frequency given for each eye separately with the eye open while the other eye being covered with an opaque patch. Subjects were asked to fix their gaze on the flash generated. They were watched for any gross eye movement or attention lapse during the procedure through the camera in the monitor. Two trials were given for each eye. The resultant curve of the flash VEP waveform consists of a series of negative N and positive P components.
Surgical technique of vitrectomy
All the surgeries are performed by the same surgeon. A standard 23 G, 3 ports Pars plana vitrectomy approach is adopted. Cases are operated under either general anaesthesia or retrobulbar anesthesia. LUMERA 700 Zeiss operating microscope (Carl Zeiss, Meditec AG, Germany) was the Resight 700 as a fundus viewing system together with Oertli vitrectomy machine (Oertli, Berneck, Switzerland).
Surgical details
- Initially, Core vitrectomy and posterior hyaloid separation was done.
- Posterior vitreous detachment was done by the vitrectomy probe in the aspiration mode only.
- Complete peeling of the posterior hyaloids was confirmed by injection of triamcinolone acetonide (Kenacort-A 40 Suspension for injection, Bristol-Myers Squibb).
- Then vitreous gel was trimmed towards the periphery. Brilliant blue G (Brillant PeelR, DORC, Rotterdam, Netherlands) was applied after partial air fluid exchange for 60 second. A 23 G (0.6mm) symmetrical end gripping micro forceps (Eckardt forceps, DORC, Rotterdam, Netherlands)) was used to create an edge of the ILM near the arcade and then used to complete the peeling maneuver to create a maculorrhexis about two disc diameter centered around the hole.
- Peripheral retinal indentation and examination for any detected breaks, peripheral holes, lattice degenerations or localized detachment.
- Endolaser photocoagulation is applied accordingly when needed. Fluid-air then air-gas exchange is done with either 12% C3F8, 16% C2F6 or 20% sulfur hexafluoride using 100 ml syringe to flush the vitreous cavity and ensure adequate air-gas exchange.
- Tight closure of the sclerotomies is done by vicryl 7/0 suture to guard against postoperative hypotony.
- Simultaneous phacoemulsification was done in the coexistence of grade II/VI to, III/VI and grade IV/VI nuclear cataract according to LOCSII.
Post-operative care
The postoperative treatment regimen included topical antibiotics (moxifloxacin hydrochloride 0.5% ophthalmic solution (VIGAMOX®)), topical steroids) (prednisolone acetate 1% ophthalmic suspension, (PRED FORTE®)) and cycloplegic eye drops (cyclopentolate hydrochloride 1%.
Systemic steroids are not prescribed unless the patient develops anterior segment inflammatory reaction with special reference to the patient physician.
Postoperative follow-up
Patients were followed up at 1st week and 3rd month postoperatively.
The following was done
Assessment of Visual acuity and best corrected distant visual acuity (BCVA), Slit lamp Biomicroscopy, Measurement of ocular tension using Goldmann applanation tonometer, Visual Evoked Potential (VEP), Electroretinography (ERG).
Statistical analysis
The collected data were coded, processed and analyzed using the SPSS (Statistical Package for Social Sciences) version 22 for Windows® (IBM SPSS Inc, Chicago, IL, USA). Data were tested for normal distribution using the Shapiro Walk test. Quantitative data were expressed as mean ± SD (Standard deviation) or median (range) according to distribution (parametric and non-parametric respectively). Paired samples t-test was used to compare between two dependent groups of normally distributed variables (parametric data) while Wilcoxon-Signed rank test was used for non-normally distributed Data (non-parametric data. The level of significance was tested, expressed as the probability of (p-value); significant if the p value is ≤ 0.05.
RESULTS
The study was conducted on 30 eyes with diabetic vitreous hemorrhage. The demographic features of the studied population were included in Table 1.
Table 1. The demographic feature of the studied population.
|
|
Range |
Mean ±SD |
|
Age (years) |
46–64 |
55.9±4.6 |
|
Sex (n, %) |
|
|
|
Females |
10, 33.3% |
|
|
Males |
20, 66.7% |
|
|
Duration of diabetes (years) |
18–25 |
20.9±2.3 |
|
HBA1c% |
5.7–9.7 |
7.5±1.1 |
|
Treatment for diabetes (n, %) |
|
|
|
Insulin injection |
14, (46.7%) |
|
|
Oral hypoglycemic |
16, (53.3%) |
|
N: Number; SD: Standard Deviation.
There was a statistically significant improvement in the Uncorrected Visual Acuity (UCVA) along the study period (p <0.001). The mean UCVA (log MAR) was 1.62 ±0.30, 1.41 ±0.39 and 1.06 ±0.31 at baseline, 1 week and 3 month postoperative (p<0.0001, Figure 1A).
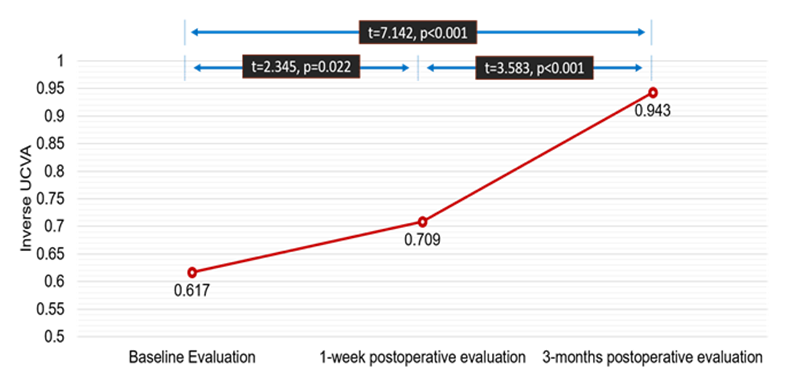
Figure 1(A). Post hoc test for the comparison of the UCVA.
There was a statistically significant improvement in the Best Corrected Visual Acuity (BCVA) along the study period (p <0.001). The mean BCVA (log MAR) was 1.62 ±0.30, 1.45 ±0.33 and 1.08 ±0.32 at baseline, 1 week and 3 months postoperative. (p<0.0001 Figure 1B)
.png)
Figure 1(B). Post hoc test for the comparison of the BCVA.
There was statistically significant improvement in the mean latency and mean amplitude of Flash VEP 2 Hz at 3 months postoperative as compared with the baseline value (p=0.029, 0.026 respectively). Table (2), Figure (2)
Table 2. Comparison of the FVEP parameters recordings between baseline and 3-months postoperative
|
|
FVEP Parameters |
Student’s t test |
||
|
|
Baseline |
3-months postoperative |
t |
p |
|
Flash VEP 2 Hz |
|
|
|
|
|
Latency P2 (ms) |
|
|
|
|
|
121 – 190 |
105– 188 |
2.236 |
0.029 |
|
150.6 ±22.6 |
136.6 ±25.8 |
||
|
Amplitude N2-P2 (μv) |
|
|
|
|
|
1.63 – 15.20 |
3.07 – 18.91 |
2.284 |
0.026 |
|
6.50 ±3.55 |
8.93 ±4.66 |
||
FVEP, Flash Visual Evoked Potential; ms, millisecond; μv, microvolt
This table shows that there was significant improvement in FVEP parameters.
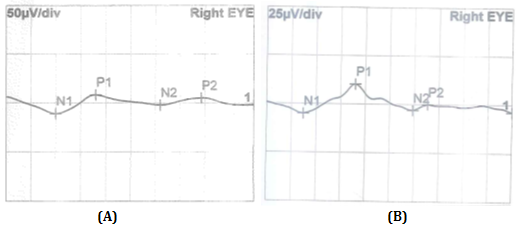
Figure 2. (A) Preoperative FVEP. (B) postoperative FVEP.
There was a statistically significant increase in the mean amplitude of all ERG parameters at 3 months postoperative as compared with the baseline value (p < 0.05). There was no statistically significant difference in the mean latency of Scotopic b-wave, combined b-wave and 30 Hz Flicker at 3 months postoperative as compared with the baseline value.
However, there was a statistically significant increase in the mean latency of Oscillatory Potentials and Photopic b-wave at 3 months postoperative as compared with the baseline value (Table 3 & Figure 3). Among the 30 patients enrolled in the study, there were 36.7% (n=11) had b/a ratio < 1 and 63.3% (n=19) had b/a ratio >1.
Table 3. Comparison of the ERG parameters recordings between baseline and 3-months postoperative
|
|
ERG Parameters |
Student’s t test |
||
|
|
Baseline |
3-months postoperative |
t |
p |
|
Scotopic b-wave |
|
|
|
|
|
Latency (ms) |
|
|
|
|
|
Range |
33 – 105 |
61 – 92 |
|
|
|
Mean ±SD |
82.3 ±18.9 |
78.7 ±9.5 |
0.941 |
0.351 |
|
Amplitude (μv) |
|
|
|
|
|
Range |
3.88 – 16.70 |
9.50 – 17.60 |
|
|
|
Mean ±SD |
10.18 ±4.47 |
13.76 ±2.64 |
3.777 |
<0.001 |
|
Combined b-wave |
|
|
|
|
|
Latency (ms) |
|
|
|
|
|
Range |
42 – 61 |
20.9 – 61 |
|
|
|
Mean ±SD |
49.9 ±5.2 |
48.4 ±10.2 |
0.726 |
0.471 |
|
Amplitude (μv) |
|
|
|
|
|
Range |
22.3 – 90.7 |
42.1 – 111.3 |
|
|
|
Mean ±SD |
61.6 ±22.5 |
77.3 ±20.5 |
2.825 |
0.006 |
|
Oscillatory Potentials |
|
|
|
|
|
Latency (ms) |
|
|
|
|
|
Range |
23.6 – 39.9 |
17.3 – 36.3 |
|
|
|
Mean ±SD |
31.1 ±5.6 |
27.0 ±6.9 |
2.527 |
0.014 |
|
Amplitude (μv) |
|
|
|
|
|
Range |
2.2 – 8.1 |
3.9 – 8.8 |
|
|
|
Mean ±SD |
4.8 ±1.7 |
6.3 ±1.4 |
3.731 |
<0.001 |
|
Photopic b-wave |
|
|
|
|
|
Latency (ms) |
|
|
|
|
|
Range |
32 – 46 |
30 – 41.1 |
|
|
|
Mean ±SD |
38.5 ±4.2 |
34.9 ±3.09 |
3.862 |
<0.001 |
|
Amplitude (μv) |
|
|
|
|
|
Range |
14.5 – 38.9 |
21.0 ±51.3 |
|
|
|
Mean ±SD |
25.8 ±7.6 |
34.3 ±9.5 |
3.827 |
<0.001 |
|
30 Hz Flicker |
|
|
|
|
|
Latency (ms) |
|
|
|
|
|
Range |
38 – 107 |
45 - 75 |
|
|
|
Mean ±SD |
64.5 ±20.1 |
64.5 ±11.5 |
0.007 |
0.994 |
|
Amplitude (μv) |
|
|
|
|
|
Range |
5.1 – 17.5 |
11.9 – 29.7 |
|
|
|
Mean ±SD |
12.2 ±3.8 |
20.0 ±5.9 |
6.088 |
<0.001 |
ERG: Electroretinogram; SD: standard deviation; ms: millisecond; μv: microvolt
There was a statistically significant positive correlation between final BCVA, UCVA with Preoperative BCVA, UCVA and at 1-week BCVA, UAVA (Table 4 & Figure 4).
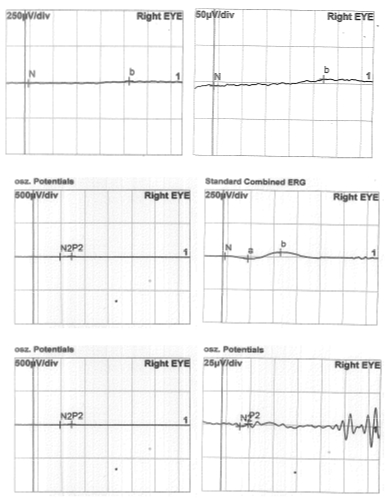
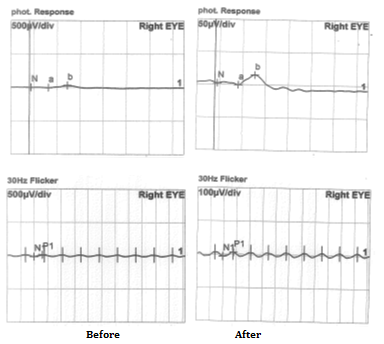
Figure3. ERG before and after vitrectomy
Table 4. Correlation of final UCVA and BCVA at 3-months postoperative with preoperative and at 1-week
|
Correlation of final UCVA at 3-months postoperative with |
r |
p |
|
0.517 |
0.003 |
|
0.711 |
<0.001 |
|
Correlation of final BCVA at 3-months postoperative with |
|
|
|
0.481 |
0.007 |
|
0.807 |
<0.001 |
UCVA: Uncorrected Visual Acuity; BCVA: Best Corrected Visual Acuity
This table shows that there was a statistically significant positive correlation between final UCVA with preoperative UCVA and UCVA at 1-week.
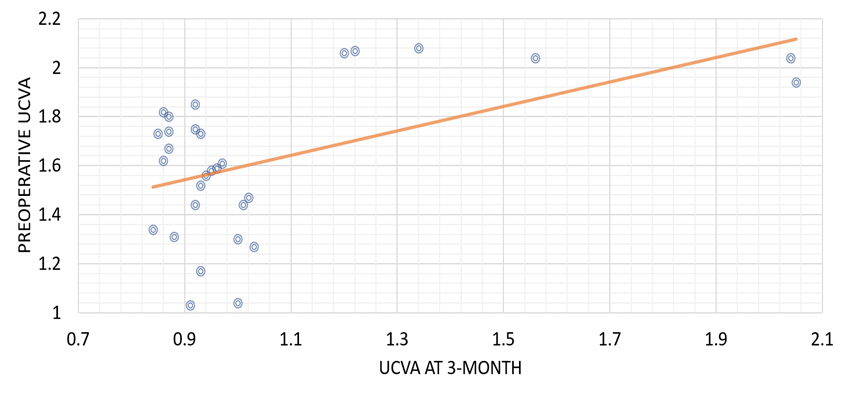
Figure 4(A). Correlation of UCVA at 3-month with preoperative UCVA.
This figure shows statistically significant positive correlation between UCVA at 3-month and preoperative UCVA.
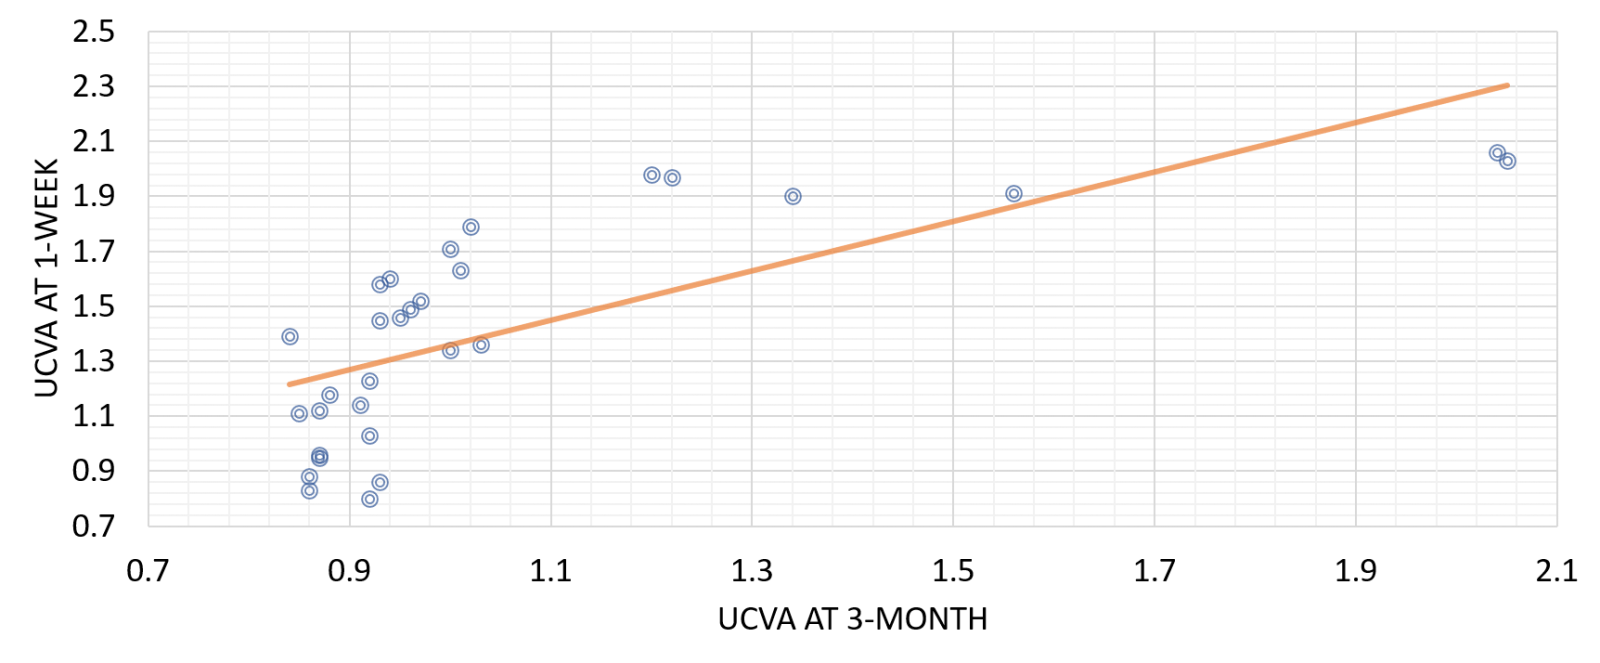
Figure 4(B). Correlation of UCVA at 3-month with 1-week UCVA.
This figure shows statistically significant positive correlation between UCVA at 3-month with 1-week UCVA.
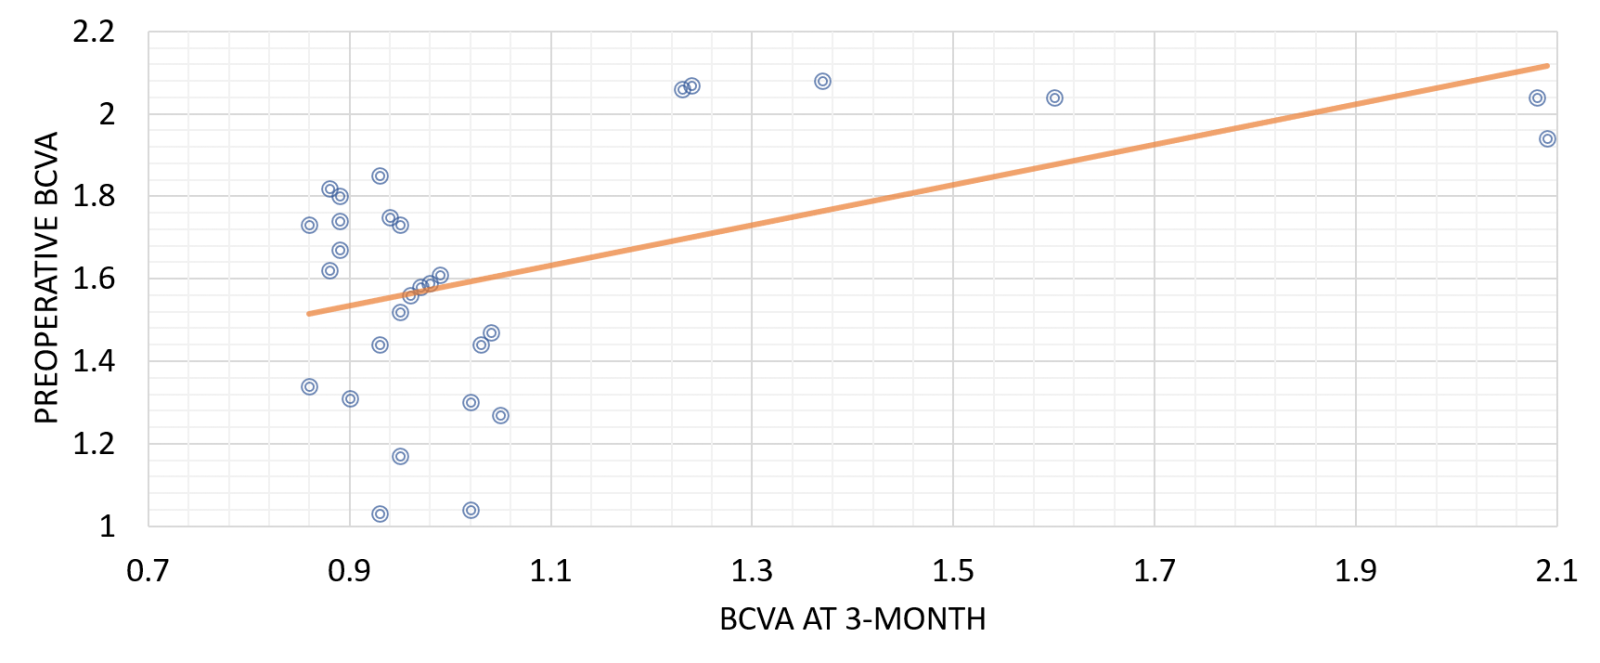
Figure 4(C). Correlation of BCVA at 3-month with preoperative BCVA.
This figure shows statistically significant positive correlation between BCVA at 3-month and preoperative BCVA.
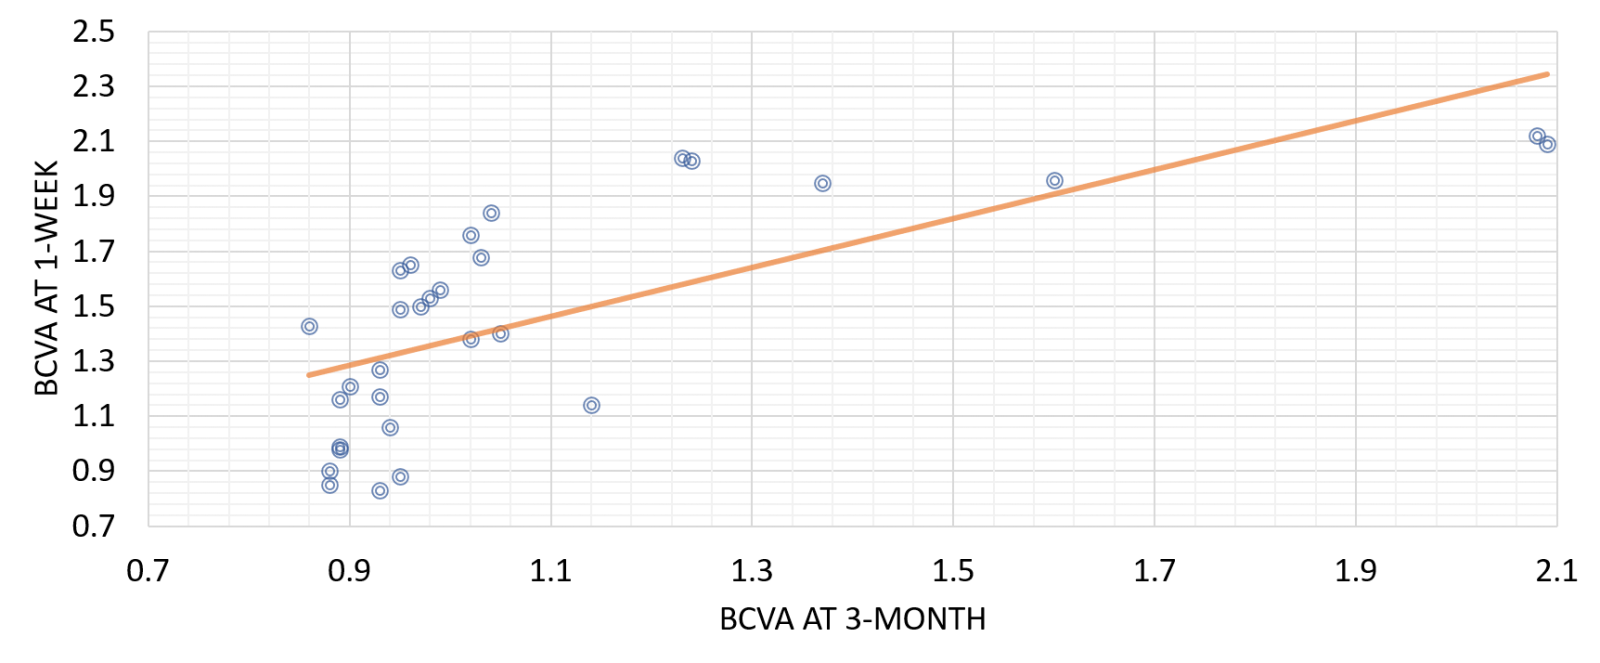
Figure 4(D). Correlation of BCVA at 3-month with 1-week BCVA
This figure shows statistically significant positive correlation between BCVA at 3-month with 1-week BCVA.
There was a statistically significant difference in the UCVA,BCVA between the preoperative and 3 months postoperative in the patients stratified by the b-wave/a-wave ratio into b/a ratio <1 and b/a ratio > 1 (Table 5 & 6).
Table 5. Change of the UCVA from preoperative to 3-month evaluation in patients stratified by the b-wave/a-wave ratio
|
|
UCVA |
|
Δ change |
Student’s t test |
|
|
|
Preoperative |
3-month postop. |
[95% CI] |
t |
p |
|
b/a ratio <1 (n=11) |
1.65 ±0.39 |
1.27 ±0.44 |
0.38 [0.01, 0.75] |
2.144 |
0.045 |
|
b/a ratio >1 (n=19) |
1.60 ±0.25 |
0.93 ±0.08 |
0.67 [0.55, 0.79] |
11.126 |
<0.001 |
N: Number; UCVA: Uncorrected Visual Acuity; CI: confidence interval
This table shows that there was a statistically significant difference in the UCVA between the preoperative and 3 months postoperative in the patients stratified by the b-wave/a-wave ratio into b/a ratio <1 and b/a ratio > 1.
Table 6. Change of the BCVA from preoperative to 3-month evaluation in patients stratified by the b-wave/a-wave ratio
|
|
BCVA |
|
Δ change |
Student’s t test |
|
|
|
Preoperative |
3-month postop. |
[95% CI] |
t |
p |
|
b/a ratio <1 (n=11) |
1.64 ±0.33 |
1.29 ±0.42 |
0.35 [0.01, 0.69] |
2.173 |
0.042 |
|
b/a ratio >1 (n=19) |
1.61 ±0.25 |
0.92 ±0.08 |
0.67 [0.57, 0.81] |
11.458 |
<0.001 |
N: number; UCVA: Uncorrected Visual Acuity; CI: Confidence Interval
Table 6 shows that there was a statistically significant difference in the BCVA between the preoperative and 3 months postoperative in the patients stratified by the b-wave/a-wave ratio into b/a ratio <1 and b/a ratio >1.
DISCUSSION AND CONCLUSION
Diabetic retinopathy (DR) is a common and devastating complication of diabetes mellitus (DM) and one of the commonest causes of legal blindness and visual impairment in the western world [6].
As the lifespan of diabetic patients has increased with the widespread use of antidiabetic medications, ocular and systemic microvascular complications of diabetes are more commonly encountered by the health care individuals [7]. In type1 DM, the frequency of PDR increases up to 41% when the duration of diabetes exceeds 15 years. In type 2 DM, on the other hand, the rate of PDR is 3% when the duration of the disease exceeds 10 years [8].
It is estimated that the number of people with diabetic retinopathy (DR) in developed countries will increase from 126.6 million in 2011 to 191 million by 2030 [9].
Vitreous hemorrhage (VH) is the commonest complication of PDR. Depending upon the severity of hemorrhage, it can cause significant reduction in vision and make the examination and treatment more difficult [10].
Pars plana vitrectomy (PPV) remains the treatment of choice for eyes in which the vitreous hemorrhage is not spontaneously resolving [11] and if vitreous hemorrhage fails to clear despite laser photocoagulation and anti-proliferative drugs (anti-VEGF) [12].
In this study, electrophysiological changes before and after pars plana vitrectomy for diabetic vitreous hemorrhage were studied and whether electroretinogram (ERG) can predict the postoperative outcome in diabetic cases where massive vitreous hemorrhage precludes fundus observation.
30 eyes of 30 patients with diabetic vitreous hemorrhage underwent pars plana vitrectomy; 11 eyes with b/a ratio <1 (group 1) and 19 eyes with b/a ratio >1 (group 2). All were followed up 3 months postoperative by ERG and VEP.
Visual acuity results
There was a statistically significant improvement in the BCVA at 1 week following the surgery (1.45 ± 0.33) as compared with the preoperative value (1.62 ± 0.30) (p=0.041) and there was more further improvement in the value of BCVA at 3 months after the surgery (1.08 ± 0.32) with high statistically significant difference as compared with the preoperative value (p< 0.001).
Similar results were reported by Iqbal et al. (2016) who showed that pre-operative and final post-operative mean BCVA LogMAR was 1.01±0.17 and 0.74±0.25 respectively. The difference in pre and postoperative BCVA was 0.045 which was statistically significant (p< 0.05) [12].
Also, Othman et al. (2014) reported final visual acuity showed improvement in 17 eyes (85%), whereas postoperative best-corrected visual acuity remained unchanged in three eyes (15%). The mean preoperative corrected visual acuity was 1.47 ± 0.73 logMAR units.
A statistically significant increase in the mean corrected visual acuity was observed in all study eyes at 3 months after surgery (0.60 ± 0.48 logMAR units; P < 0.001) [13].
However, Wu et al. (2017) conducted a study that included 82 eyes of 82 patients with vitreous haemorrhage or opacity due to ocular trauma, retinal detachment or retinal vascular diseases including diabetic retinopathy (non selective cases) and they compared these results with the values 2 weeks after vitrectomy operation. The authors revealed that there was no improvement or reduction in postoperative visual acuity [14].
VEP results
In this study, according to the analysis of Flash VEP parameters, there was statistically significant improvement in the mean latency of Flash VEP at 3 months postoperative as compared with the baseline value (p=0.029). Similarly, there was statistically significant improvement in the mean amplitude of Flash VEP at 3 months postoperative as compared with the baseline value (p=0.026).
In the study conducted by Kim et al. (2017) the mean VEP P2 amplitude was 13.09 ± 4.63 μV in the eyes with vitreous haemorrhage and PDR which was statistically significant lower as compared with the normal eyes (18.43 ± 8.96 μV) (p=0.024). Also, they showed that the mean VEP P2 peak time was 125.17 ± 12.26 ms in the eyes with vitreous haemorrhage and PDR which was statistically significant longer as compared with the normal eyes (18.43 ± 8.96 μV) (p= 120.88 ± 8.08) [15].
ERG results
Dense vitreous haemorrhage and other media opacities affect electrophysiological responses by absorbing, reflecting and scattering the incoming light stimulus. In addition to removing the media opacity, vitrectomy has also considerable consequences for eye physiology as oxygen transport.
In our study, the analysis of the different parameters of full field ERG has revealed statistically significant improvement in all the tested parameters following vitrectomy as compared with the preoperative values.
Regarding the analysis of Scotopic b-wave in the study cases, the mean preoperative latency duration was 82.3 ± 18.9 ms which was longer as compared with the 3-month postoperative latency duration (78.7 ± 9.5 ms), but it didn’t reach a statistically significant value (p=0.351). The mean 3-month postoperative amplitude was 13.76 ± 2.64 μv which was statistically significant improved as compared with the mean preoperative amplitude (10.18 ± 4.47 μv) (p< 0.001).
The analysis of Combined b-wave in the study cases, the mean preoperative latency duration was 49.9 ± 5.2 ms which was slightly longer as compared with the 3-month postoperative latency duration (48.4 ± 10.2 ms), but it didn’t reach a statistically significant value (p=0.471). The mean 3-month postoperative amplitude (77.3 ± 20.5 μv) which was statistically significant improved as compared with the preoperative amplitude which was 61.6 ± 22.5 μv (p< 0.006).
The analysis of Oscillatory Potentials in the study cases, the mean preoperative latency duration was 31.1 ± 5.6 ms which was statistically significant longer as compared with the 3-month postoperative latency duration (27.0 ± 6.9 ms) (p=0.014). The mean 3-month postoperative amplitude (6.3 ± 1.4 μv) was statistically significant improved as compared with the preoperative amplitude (4.8 ± 1.7 μv) (p=0.001).
The analysis of photopic b-wave in the study cases, the mean preoperative latency duration was 38.5 ± 4.2 ms which was statistically significant longer as compared with the 3-month postoperative latency duration (34.9 ± 3.09 ms) (p< 0.001). The mean 3-month postoperative amplitude (34.3 ± 9.5 μv) was statistically significant improved as compared with the preoperative amplitude (22.8 ± 7.6 μv) (p< 0.001).
The analysis of 30 Hz Flicker in the study cases, the mean preoperative latency duration was 64.5 ± 20.1 ms and at the 3-month postoperative latency duration (64.5 ± 11.5 ms) with no significant difference. The mean 3-month postoperative amplitude (20.0 ± 5.9 μv) which was statistically significant improved as compared with the preoperative amplitude (12.2 ± 3.8 μv) (p< 0.001).
In agreement of our results, Abdelkader et al. [16] carried out a study on 25 eyes of 25 patients with diabetic macular edema to evaluate the effect of successful vitrectomy on retinal function in diabetic patients. At 3 month postoperative, the amplitude responses were increased compared to preoperative value [16]. Our study confirmed that preoperative UCVA, BCVA and b/a ratio had statistically significant association with postoperative visual outcome.
There was a statistically significant difference in both UCVA and BCVA between the preoperative and 3 months postoperative in the eyes stratified by the b-wave/a-wave ratio into b/a ratio <1 and b/a ratio > 1. The eyes with a b/a ratio >1.0 had better postoperative visual acuity than eyes with a b/a ratio < 1.0. Within the same context, the Japanese study of Hiraiwa T. [17] detected that eyes with b/a ratio <1.0 had worse postoperative visual acuity than eyes with a b/a ratio >1.0 [17].
Results were also in harmony with Wu et al. [14] who showed that preoperative visual electrophysiology was significantly correlated with the effectiveness of the operation. It is helpful in the prognostic assessment of postoperative visual outcome [14].
CONFLICT OF INTEREST
No Authors has proprietary interest.
FINANCIAL SUPPORT
Mansoura University Ophthalmic Center, Egypt.
ETHICAL APPROVAL
This study was approved by the Human Subjects Committee of the University of Mansoura, and adhered to the Declaration of Helsinki. Written informed consent was obtained from all participants.
REFERENCES
- El Annan J, Carvounis PE. (2014). Current Management of Vitreous Hemorrhage Due to Proliferative Diabetic Retinopathy. Int Ophthalmol Clin. 54:(2):141-153.
- Stefánsson E. (2009). Physiology of vitreous surgery. Graefes Arch Clin Exp Ophthalmol. 247:(2):147-163.
- Marmor MF, Fulton AB, Holder GE, Miyake Y, Brigell M, Bach M. (2008). ISCEV Standard for full-field clinical electroretinography (2008 update). Doc Ophthalmol. 118:(1):69-77.
- Raz N, Dotan S, Chokron S, Ben-Hur T, Levin N. (2012). Demyelination affects temporal aspects of perception: An optic neuritis study. Ann Neurol. 71(4):531-538.
- McCulloch DL, Marmor MF, Brigell MG, Hamilton R, Holder GE, Tzekov R, et al. (2015). ISCEV Standard for full-field clinical electroretinography (2015 update). Doc Ophthalmol. 130:(1):1-12.
- Simo R, Hernandez C. (2015). Novel approaches for treating diabetic retinopathy based on recent pathogenic evidence. Prog Retin Eye Res. 48:160-180.
- Chertman LS, Neuman D, Vendrame F. (2020). Update on Diabetes Medical Management: Epidemiology and Treatment. Behavioral Diabetes. Switzerland: Springer. p. 261-275.
- Hall V, Thomsen RW, Henriksen O, Lohse N. (2011). Diabetes in Sub Saharan Africa 1999-2011: epidemiology and public health implications. A systematic review. BMC public health. 11:(1):564.
- Pescosolido N, Barbato A, Stefanucci A, Buomprisco G. (2015). Role of electrophysiology in the early diagnosis and follow-up of diabetic retinopathy. J Diabetes Res. 2015:319692.
- Nakao S, Ishikawa K, Yoshida S, Kohno RI, Miyazaki M, Enaida H, et al. (2013). Altered vascular microenvironment by bevacizumab in diabetic fibrovascular membrane. Retina. 33:(5):957-963.
- Taskintuna I, Elsayed MEA, Taskintuna K, Ahmad K, Khandekar R, Schatz P, et al. (2020). Comparison of outcomes of four different treatment modalities for diabetic vitreous haemorrhage. Sci Rep. 10:(1):1-6.
- Iqbal A, Orakzai OK, Khan MT, Jan S. (2016). Visual outcome after pars plana vitrectomy in diabetic vitreous hemorrhage. Journal of Postgraduate Medical Institute (Peshawar-Pakistan). 30:(1).
- Othman M, Moharram H, Eldin R. (2014). Clinical outcome of preoperative and intraoperative intravitreal injection of bevacizumab as an adjunct to vitrectomy in the treatment of proliferative diabetic retinopathy. J Egypt Ophthalmol Soc. 107:(1):5-9.
- Wu L, Wu D, Luo T. (1997). The significance of preoperative visual electrophysiology for vitrectomy. Zhonghua yan ke za zhi. 33:(5):344-346.
- Kim YK, Kim HD, Park TK, Ohn YH. (2017). Simultaneous Recording of Flash Electroretinography and Visual Evoked Potential in Vitreous Hemorrhage with Diabetic Retinopathy. J Korean Ophthalmol Soc. 58:(3):305-312.
- Abdelkader M, Mamdouh M, Fawzy A. (2019). Evaluation of Macular Function after Vitrectomy in Diabetic Macular Edema. Journal of Advanced Plastic Surgery Research. 5:18-26.
- Hiraiwa T. (2003). Preoperative Electroretinogram and PostoperativeVisual Outcome in Patients with Diabetic Vitreous Hemorrhage. Jpn J Ophthalmol. 47(3):307-311.