Information Links
Related Conferences
Current Issue Volume 7, Issue 1 - 2025
Exploring The Role of Iron Accumulation and Muscle Parameters as Potential Risk Factors for Sarcopenia
Mahamane Rahoufou Tounaoua1, Zakari Shaibu2, Zhao Guo-Yang3,*
1Department of Orthopedics, the Affiliated Hospital of Jiangsu University, Zhenjiang, 212000, P.R. China
2School of Medicine, Jiangsu University, Zhenjiang, Jiangsu Province, 212013, China
3Department of Orthopedics, the Affiliated Hospital of Jiangsu University, Jiangsu University, Zhenjiang, Jiangsu Province, 212013, China
*Corresponding author: Dr. Zhao Guo-Yang, Department of Orthopedics, the Affiliated Hospital of Jiangsu University, Jiangsu University, Zhenjiang, Jiangsu Province-212013, China, Phone: 18252583559, ORCID ID: 0000-0002-6980-9997, Email: [email protected]
Received Date: April 26, 2025
Published Date: June 23, 2025
Citation: Tounaoua MR, et al. (2025). Exploring The Role of Iron Accumulation and Muscle Parameters as Potential Risk Factors for Sarcopenia. Orthop Res J. 7(1):30.
Copyrights: Tounaoua MR, et al. © (2025).
ABSTRACT
Iron accumulation and sarcopenia represent a critical intersection in aging research, yet their relationship remains poorly understood. This study explores how iron biomarkers (ferritin, serum iron among others) and muscle parameters (BMI, SMI and so on) associate with sarcopenia risk in adults aged 60–80, while probing CRP’s paradoxical role. Our findings reveal ferritin’s marginal risk association, the protective effects of BMI/SMI, and CRP’s unexpected inverse relationship with sarcopenia, challenging conventional inflammation paradigms. These insights highlight the complexity of iron-muscle interactions in aging.
Keywords: Iron, Muscle Atrophy, Skeletal Muscle, Ferritin, Sarcopenia.
INTRODUCTION
Sarcopenia is a progressive age-related condition characterized by the decline of skeletal muscle mass, strength, and physical performance. Both the Asian Working Group for Sarcopenia (AWGS) and the European Working Group on Sarcopenia in Older People (EWGSOP) define sarcopenia as involving reduced muscle mass alongside low muscle strength or physical function [1,2]. The updated EWGSOP2 consensus classifies sarcopenia as a “muscle disease” with varying severity, from probable sarcopenia (low strength) to severe sarcopenia (low strength and muscle quantity/quality) [3]. Sarcopenia affects 5–13% of adults over 60 years old, rising to 50% in those over 80 [4,5], with projected global cases exceeding 200 million by 2060. This condition is a major contributor to frailty, disability, and increased mortality, highlighting the need for early detection and intervention.
Iron homeostasis is critical for muscle function, yet dysregulation—whether through deficiency or excess—may accelerate the development of sarcopenia. Iron deficiency impairs oxidative metabolism, oxygen transport, and energy production, all essential processes for muscle maintenance and repair [6-13]. In skeletal muscle, which stores approximately 10–15% of total body iron [14,15], insufficient iron can disrupt muscle protein synthesis and mitochondrial function, potentially leading to sarcopenia [7,10,11].
Conversely, iron accumulation has been associated with increased oxidative stress due to excessive generation of reactive oxygen species (ROS), which can damage muscle tissue and impair its endocrine function [12,16]. Experimental models have linked iron accumulation to skeletal muscle atrophy during aging [12], though clinical evidence remains limited and inconclusive [13,17]. Both extremes, deficiency and excess underscore the importance of maintaining iron balance to preserve muscle integrity, yet the precise relationship between iron status and sarcopenia risk remains unclear.
We hypothesize that iron accumulation, as indicated by elevated ferritin and serum iron levels, increases the risk of sarcopenia independently of body mass index (BMI) and systemic inflammation (measured by C-reactive protein, CRP). This study also explores whether inflammation, while contributing to muscle decline, may interact with compensatory mechanisms that mitigate its impact.
MATERIALS AND METHOD
A cross-sectional study was conducted using data collected between the years 2022-2023 at the affiliated hospital of Jiangsu University. Patients’ data including serum ferritin, serum iron, transferrin, total iron binding capacity, transferrin saturation, CRP, white blood cells count, were extracted and analyzed, combined with muscles indexes such as Total skeletal muscle mass (SMM), Skeletal Muscle Index (SMI) and Body Muscle Index (BMI) as shown in Table 1.
Laboratory method-Blood indicators
Hematologic indicators, especially hemoglobin, are commonly measured in clinics and laboratories using flow cytometry with fully automated cell counters, due to their precision [18]. In this study, serum ferritin and transferrin were measured using immunoassay, whereas serum iron, TIBC were measured using colorimetric reaction with ferrozine as a chromogen to form a color complex with iron. On the other hand, CRP and WBC were obtained via a cellometer ascend automated cell counter machine, a benchtop instrument offering fast and reliable cell counts with small volumes. It is worth noting that blood samples from all subjects were collected in the early morning while fasting.
Anthropometric measurements
We used human body composition analyzer model TANITA(ME180), and Electrochemiluminescence immunoassay combined with BIA (bioelectrical impedance analysis), which are considered the reference and most frequently used tools for assessing skeletal muscle mass. Thus, we measured the SMM via BIA method, and then we calculated the SMI using the following formula: SMI = SMM/Height2. BMI was calculated as weight (kg) divided by height2 (m). The height and weight were measured according to the standard protocol, using a fixed stadiometer and digital scale.
Muscle Strength Measurement: Handgrip strength was assessed using a hand dynamometer. Participants were seated with their elbow at a 90-degree angle and forearm resting on a stable surface. A minimum of three trials were conducted, with the highest value recorded.
Physical Performance Assessment: Gait speed was measured by timing participants as they walked a 6-meter distance at a consistent pace. Each participant performed at least two trials, and the average was used for analysis. This test is a validated measure of functional physical performance in older adults.
Table 1. Baseline Characteristics of Study Participants (N=102)
|
|
Number (%) |
Mean±SD |
Median (IQR) |
|
Male |
31(30.4%) |
-- |
-- |
|
Female |
71(69.6%) |
-- |
-- |
|
Sarcopenia (Yes) |
27(26.5%) |
-- |
-- |
|
Sarcopenia (No) |
75(73.5%) |
-- |
-- |
|
Age (years) |
|
65.5±5.2 |
65.0(8.0) |
|
Height (meters) |
|
1.6±0.1 |
1.6(0.1) |
|
Weight (kg) |
|
61.4±9.1 |
60.4(14.5) |
|
BMI |
|
23.5±2.9 |
23.5(3.8) |
|
Serum Iron |
|
22.5±15.8 |
20.2(6.6) |
|
Ferritin |
|
166.7±106.8 |
145.9(87.4) |
|
Transferrin |
|
2.9±0.4 |
2.9(0.5) |
|
Total iron binding cells (TIBC) |
|
60.1±7.0 |
60.4(8.7) |
|
Transferrin saturation |
|
35.5±9.9 |
34(12.2) |
|
CRP |
|
1.5±1.2 |
1.2(1.1) |
|
White blood cells |
|
5.7±2.0 |
5.4(1.7) |
|
SMI |
|
6.6±1.1 |
6.4(1.0) |
|
Appendicular muscle mass (SMM) |
|
38.6±6.4 |
37.7(7.6) |
Table 2. Comparative Analysis of Iron Status, Muscle Mass, and Inflammatory Markers by Sarcopenia Status
|
|
With Sarcopenia (27) |
Without Sarcopenia (75) |
p-value |
|
Male (Number) |
9 |
22 |
0.886 |
|
Female (Number) |
18 |
53 |
|
|
Age (years) Mean±SD |
65.1±5.1 |
66.4±5.4 |
0.304 |
|
Height (meters) Mean±SD |
1.6±0.1 |
1.6±0.1 |
0.226 |
|
Weight (kg) Mean±SD |
64.1±8.6 |
54.0±5.8 |
<0.001* |
|
BMI (kg/m2) Mean±SD |
24.4±2.6 |
21.0±1.8 |
<0.001* |
|
Serum Iron (micromol/l) Mean±SD |
21.1±5.9 |
20.9±4.8 |
0.934 |
|
Ferritin (ng/ml) Mean±SD |
160.1±96.8 |
185.1±130.9 |
0.695 |
|
Transferrin (g/l) Mean±SD |
3.0±0.4 |
2.9±0.3 |
0.774 |
|
Total iron binding capacity (TIBC) (micromol/l) Mean±SD |
60.3±7.3 |
59.4±6.2 |
0.701 |
|
Transferrin saturation (%) Mean±SD |
35.5±10.3 |
35.6±8.6 |
0.845 |
|
CRP (mg/dl) Mean±SD |
1.7±1.3 |
1.0±0.7 |
0.002* |
|
White blood cells (cells/microliter) Mean±SD |
5.6±1.6 |
5.6±1.7 |
0.934 |
|
SMI (kg/m2) Mean±SD |
6.8±1.1 |
5.9±0.7 |
<0.001* |
|
Total skeletal muscle mass (kg) Mean±SD |
39.8±6.4 |
35.3±5.0 |
0.005* |
Participants with sarcopenia had significantly lower weight, BMI, SMI, and skeletal muscle mass (all p<0.01), but comparable iron markers (all p>0.05). Despite higher CRP levels in sarcopenic individuals (1.7 ± 1.3 vs. 1.0 ± 0.7 mg/dL, p=0.002; Table 2), regression models paradoxically associated elevated CRP with reduced risk (OR=0.45).
Study population
The study focused on participants aged 60 and above, with complete data on specified variables, and who provided informed consent, while excluding individuals with chronic illnesses such as (liver disease, kidney disease, rheumatoid disease, endocrine system disease, chronic inflammatory diseases, and similar conditions), malignant or hematological disease, muscle disease under drug effect, recent blood transfusions, as well as those with missing data. Moreover, the study exclusively gathered clinical data from patients without altering their treatment plans, ensuring any potential physiological risks are mitigated. The researchers involved in this process took extensive measures to safeguard the confidentiality of patient information. Additionally, the study followed ethical protocols and guidelines for research involving human subjects. This study has been reviewed and approved by the Biomedical Research Ethics Committee of the Affiliated Hospital of Jiangsu University (SWYXLL20210401-16).
Statistical analysis
The statistical analysis was conducted using IBM SPSS Statistics software version 28. Descriptive statistics, such as mean and standard deviation, were calculated for continuous variables, while frequencies and percentages were determined for categorical variables. To compare iron-related markers and muscle parameters between the two groups (with and without sarcopenia), Mann Whitney U test was performed for continuous variables, and the chi-square test was used to compare the distribution for the categorical variables. To explore the relationship between various factors and the risk of sarcopenia, both univariate and multivariate regression analyses were employed. The univariate analysis allowed for the identification of individual associations between each variable and sarcopenia, while the multivariate analysis provided a more comprehensive understanding by adjusting for potential confounders, enabling the assessment of independent associations. While muscle strength and physical performance measures (handgrip strength and gait speed) were collected, they were excluded from the regression models to prioritize biochemical and anthropometric predictors. These functional measures were retained for descriptive analysis. In this study, the multivariate analysis was performed using a backward stepwise variable selection, i.e. a process where we begin with a model that contains all variables under consideration (called the full model), and then we remove the least significant variables one after the other. Throughout this study, the statistical significance level was set at a p-value of less than 0.05.
RESULTS
The study included 102 participants (30.4% male; median age 65 years), with sarcopenia prevalence of 26.5% (n=27). As shown in Table 1, sarcopenic participants had significantly lower weight (54.0 vs 64.1 kg, p<0.001), BMI (21.0 vs 24.4 kg/m², p<0.001), and skeletal muscle mass (35.3 vs 39.8 kg, p=0.005), but comparable iron markers (all p>0.05; Table 2).
Univariate analysis (Table 3) identified BMI (OR=0.49, 95% CI: 0.36–0.67), weight (OR=0.82, 0.75–0.90), SMI (OR=0.18, 0.08–0.43), and appendicular muscle mass (OR=0.87, 0.79–0.95) as protective factors (all p<0.01). CRP showed a paradoxical inverse association (OR=0.45, 0.25–0.84, p=0.012).
In the adjusted multivariate model (Table 4), BMI (OR=0.52, 0.37–0.74), SMI (OR=0.18, 0.06–0.62), and CRP (OR=0.51, 0.27–0.96) remained significant, while ferritin showed marginal risk elevation (OR=1.01, 1.00–1.02, p=0.009). Complete results are in Supplementary Table S1.
Despite higher CRP levels in sarcopenic participants (1.7 ± 1.3 vs. 1.0 ± 0.7 mg/dL, p=0.002; Table 2), regression models associated elevated CRP with reduced sarcopenia risk (OR=0.45–0.51). As mentioned in the methods section Muscle strength and Physical performance measures were collected but excluded from regression models to prioritize iron-muscle mass relationships. This decision was based on considerations of multicollinearity and clinical relevance, ensuring a more robust and interpretable model.
Table 3. Univariate Logistic Regression Analysis of Key Sarcopenia Predictors
|
Variables |
Univariate Analysis |
|
|
p-value |
OR (95%CI) |
|
|
Weight |
<0.001* |
0.82 [0.75; 0.90] |
|
BMI |
<0.001* |
0.49 [0.36; 0.67] |
|
CRP |
0.012* |
0.45 [0.25; 0.84] |
|
SMI |
<0.001* |
0.18 [0.08; 0.43] |
|
Appendicular muscle mass |
0.003* |
0.87 [0.79; 0.95] |
Only statistically significant predictors (p<0.05) shown. Complete results in Supplementary Table S1
In univariate analysis (Table 3), higher BMI (OR=0.49, 95% CI: 0.36–0.67), SMI (OR=0.18, 0.08–0.43), and CRP (OR=0.45, 0.25–0.84) were associated with reduced sarcopenia risk (all p<0.05). Multivariate analysis (Table 4) confirmed these associations after adjustment (BMI: OR=0.52, 0.37–0.74; SMI: OR=0.18, 0.06–0.62; CRP: OR=0.51, 0.27–0.96). Ferritin showed no univariate association (p=0.301) but a marginal risk increase in the multivariate model (OR=1.01, 1.00–1.02; p=0.009).
Table 4. Final Multivariate Model of Factors Independently Associated with Sarcopenia
|
Variables |
Multivariate Analysis |
|
|
p-value |
OR (95%CI) |
|
|
BMI |
<0.001* |
0.52 [0.37; 0.74] |
|
Ferritin |
0.009* |
1.01 [1.0; 1.02] |
|
C-reactive protein (CRP) |
0.037* |
0.51 [0.27; 0.96] |
|
SMI |
0.006* |
0.18 [0.06; 0.62] |
Statistically significant at 5% level (p-value < 0.05)
Adjusted for covariates via backward stepwise selection. Full model details in Supplementary Table S1.
After adjustment (Table 4), BMI (OR=0.52, 0.37–0.74), SMI (OR=0.18, 0.06–0.62), and CRP (OR=0.51, 0.27–0.96) remained protective, while ferritin showed marginal risk elevation (OR=1.01, 1.00–1.02, p=0.009).
Supplementary Table S1. Complete Univariate and Multivariate Logistic Regression Results for All Analyzed Variables
|
Variable |
Univariate OR (95% CI) |
Univariate p-value |
Multivariate OR (95% CI) |
Multivariate p-value |
Retained in Final Model? |
|
Age |
1.05 (0.97–1.14) |
0.257 |
– |
– |
No |
|
Gender (Male vs Female) |
0.95 (0.36–2.49) |
0.92 |
– |
– |
No |
|
Height |
0.01 (0.00–15.36) |
0.22 |
– |
– |
No |
|
Weight |
0.82 (0.75–0.90) |
<0.001* |
– |
– |
No |
|
BMI |
0.49 (0.36–0.67) |
<0.001* |
0.52 (0.37–0.74) |
<0.001* |
Yes |
|
Serum Iron |
0.99 (0.94–1.04) |
0.581 |
– |
– |
No |
|
Ferritin |
1.00 (1.00–1.01) |
0.301 |
1.01 (1.00–1.02) |
0.009* |
Yes |
|
Transferrin |
0.65 (0.20–2.08) |
0.467 |
– |
– |
No |
|
TIBC |
0.98 (0.92–1.05) |
0.55 |
– |
– |
No |
|
Transferrin Saturation |
1.00 (0.96–1.05) |
0.983 |
– |
– |
No |
|
CRP |
0.45 (0.25–0.84) |
0.012* |
0.51 (0.27–0.96) |
0.037* |
Yes |
|
White Blood Cells (WBC) |
1.08 (0.87–1.33) |
0.499 |
– |
– |
No |
|
SMI |
0.18 (0.08–0.43) |
<0.001* |
0.18 (0.06–0.62) |
0.006* |
Yes |
|
SSM |
0.87 (0.79–0.95) |
0.003* |
– |
– |
No |
"–" = variable not retained in final multivariate model after backward stepwise selection.
Retained in Final Model? explicitly shows which variables were included in Table 4.
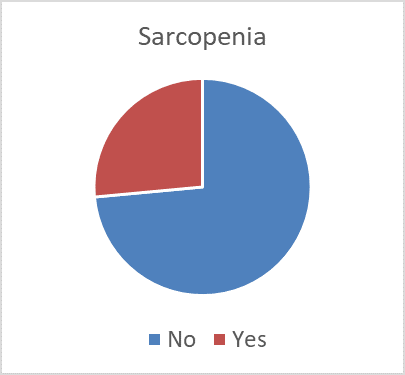
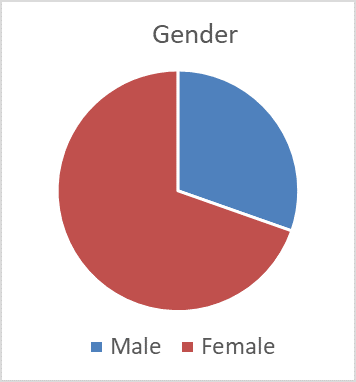
Figure 1. Distributions of gender, and sarcopenia in the study cohort.
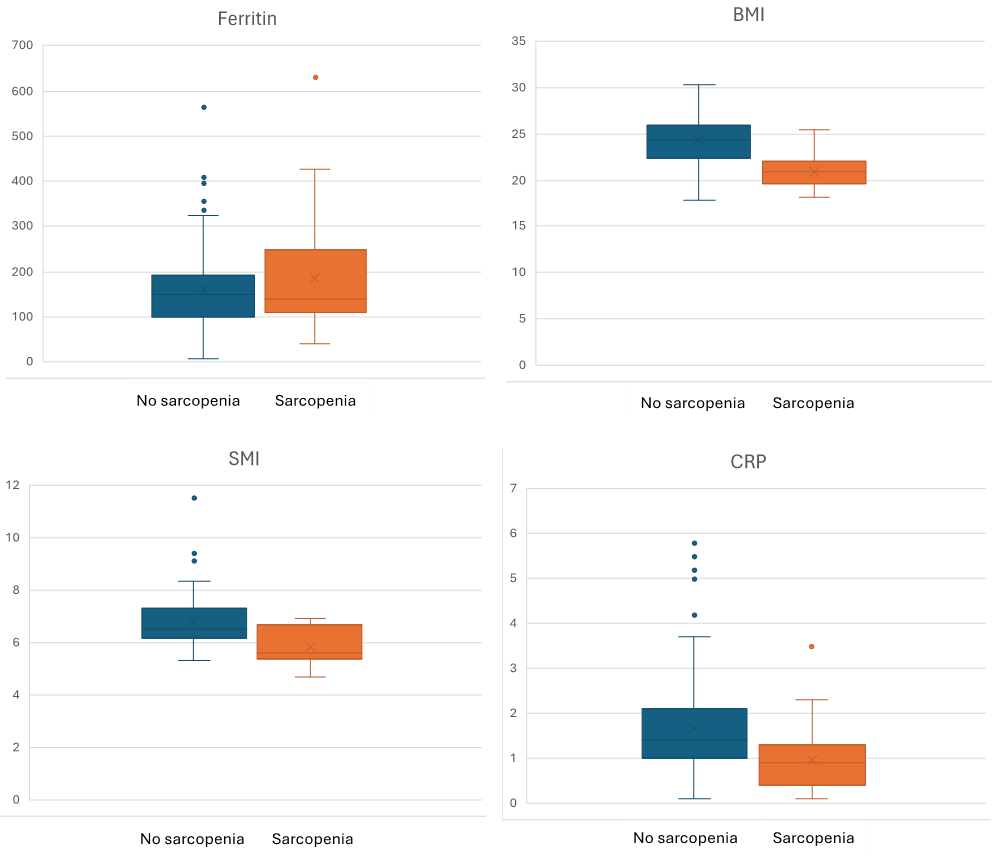
Figure 2. Key Biomarker and body composition profiles distrribution in Sarcopenic vs. Non-Sarcopenic Groups.
Comparative analysis of clinical biomarkers between sarcopenic (red) and non-sarcopenic (blue) groups. Dotted lines indicate established clinical thresholds: ferritin (>200 ng/mL, suggesting (iron accumulation) and BMI (<18.5 kg/m², underweight). Error bars represent 95% confidence intervals. Significant differences were observed in SMI (p=0.006), ferritin (p=0.009), BMI (p<0.001), and CRP (p=0.037) via multivariate analysis (see Methods).
DISCUSSION
Building on growing evidence linking iron metabolism to muscle health [19,20], our study provides new insights into three key relationships: (1) the protective effects of higher BMI and SMI against sarcopenia, (2) the marginal but significant association between elevated ferritin and increased sarcopenia risk, and (3) the paradoxical relationship between CRP levels and sarcopenia risk.
Sarcopenia refers to the loss of muscle mass, strength, and function that occurs with aging, primarily impacting older adults and leading to increased frailty, reduced mobility, and greater risk of falls [21]. Muscle mass loss, a key indicator of sarcopenia, is linked to a higher risk of fractures, compromised physical function and a decline in quality of life [1]. One increasingly investigated factor is iron accumulation and its role in promoting muscle degeneration. Iron is essential for numerous biological processes, including enzymatic activity, mitochondrial function, DNA synthesis, and energy metabolism [22-24]. Its dysregulation, particularly in aging, can lead to detrimental effects on health. While the liver and spleen store most of the body’s iron, skeletal muscle also contains smaller amounts, and excessive iron or iron accumulation, could potentially have adverse effects on skeletal muscle health [12,25] Unlike many other minerals, the body has no active mechanism to eliminate excess iron [26]. Small amounts are lost daily through shedding of intestinal cells, sweat, and in women menstrual blood loss [27]. However, as people age, iron accumulates due to the lack of an effective excretory pathway, which can lead to the onset of various diseases [28].
Despite notable progress in deciphering the etiology of sarcopenia [29,30], the connection between iron status and sarcopenia is still not well understood. In this context, our analysis revealed that higher levels of ferritin were associated with an increased risk of sarcopenia (OR=1.01, 95% CI: 1.00-1.02, p=0.009), while elevated muscle indexes such as SMM, weight, SMI and BMI were protective factors, with SMI and BMI consistently showing a protective effect. Though the small effect size suggests limited clinical significance as an independent predictor. These findings are consistent with previous studies that have suggested a relationship between serum ferritin and sarcopenia as well as the role of BMI. For instance, a cohort study involving 639 hospitalized elderly individuals showed significantly higher serum ferritin levels in the sarcopenia group compared to healthy controls, with levels exceeding the normal range (>145 ug/dl) in sarcopenic patients [31]. Similarly, a study in 2014 [32], involving 1380 middle-aged and elderly Korean women, discovered that individuals with sarcopenia exhibited significantly higher serum ferritin levels, with those having elevated serum ferritin facing a 2.02-fold increased risk compared to those with normal levels. As mentioned above, our study found that higher BMI (OR=0.55, p<0.001) was an important variable and acted as a protective factor against sarcopenia. Moroni et al. [33] supported this finding, reporting that, according to random forest analysis, a higher BMI was the most important protective factor for sarcopenia, for sarcopenic obesity (along with Iron) and for osteosarcopenia (along with albumin). Moreover, Sung Jing Moon et al. [34] found that the mean age, the body mass index (BMI), and HOMA-IR were higher and caloric intake, physical activity, and vitamin D level were lower in the sarcopenia groups in both men and women. Altun et al. [35], and Jung et al. [36] observed notably higher non-heme iron levels in the skeletal muscles of elderly rats, while Xu et al. [37] suggested that iron accumulation could be a characteristic feature of aging skeletal muscles. In the same context, some clinical investigations have highlighted a notable link between iron accumulation and sarcopenia. For example, Marzetti et al. [38] reported that iron accumulation in skeletal muscle has been suggested to contribute to the pathogenesis of sarcopenia and acute muscle atrophy. Additionally, in 2017, a study of 639 Italians aged 65 and above found increased serum ferritin levels in sarcopenic patients along with elevated serum inflammatory markers [31]. However, contrary to our findings and some supportive studies, Zhi Chen et al. also observed a negative correlation between serum ferritin and muscle mass, even after adjusting for potential confounder [19]. Similarly, a 2016 study of 300 hemodialysis patients revealed a significant negative correlation between forearm grip strength and serum ferritin levels [39]. Bartali et al. [40], in a longitudinal study involving 698 participants, did not also find a significant association between serum iron levels and physical function, possibly due to differences in study design or participant characteristics.
The most intriguing finding was CRP's dual association - while levels were higher in sarcopenic participants (1.7 vs 1.0 mg/dL, p=0.002), elevated CRP paradoxically correlated with reduced sarcopenia risk in regression models (OR=0.45-0.51). This challenges conventional views of inflammation's role in muscle wasting. We propose three potential explanations: first, the Inflammatory Context: Chronic low-grade inflammation [41] may drive sarcopenia, while acute CRP spikes could reflect protective stress responses [42]. Second, Measurement Timing: Single CRP measurements cannot distinguish persistent inflammation from transient elevations. Third, Confounding Factors: Unmeasured variables like comorbidities or medications may differentially affect CRP and muscle mass. This complexity may explain why some studies report no CRP-sarcopenia association [43-45], highlighting the need for longitudinal cytokine profiling.
Although our primary focus was on iron biomarkers and muscle mass indicators, we also collected Muscle strength and physical performance measures, which are widely recognized in sarcopenia research [46-48], These variables were excluded from regression models to maintain focus on iron-muscle relationships; however, they will be analyzed in future longitudinal work to explore functional implications.
Taken together, our findings shed light on the complex interplay between body composition, inflammation, and iron metabolism in sarcopenia. The protective roles of BMI and SMI were consistently observed, while the unexpected inverse association between CRP and sarcopenia highlights the need to interpret inflammatory markers with caution. Additionally, the modest yet significant association between ferritin and sarcopenia risk suggests a potential role for iron status in muscle health. These results emphasize the multifactorial nature of sarcopenia and the importance of comprehensive approaches to its assessment.
LIMITATIONS
This study has several limitations that should be considered when interpreting the findings. Firstly, the cross-sectional design precludes establishing causal relationships between iron biomarkers and sarcopenia. Secondly, while we measured muscle strength and physical performance via handgrip strength and gait speed, respectively, these functional measures were not included in our regression models. Future studies should incorporate them, as they are part of diagnostic criteria. Thirdly, single measurements of iron and inflammatory markers may not reflect chronic status, potentially leading to misclassification. Lastly, residual confounding from unmeasured factors such as physical activity or diet may influence the observed associations. Additionally, the small sample size may limit the generalizability of the findings and increase the risk of Type II errors. Larger, more diverse cohorts are needed to validate these results and enhance external validity.
CONCLUSION
This study highlights that elevated BMI and SMI are protective against sarcopenia, while increased ferritin levels are associated with a modest rise in sarcopenia risk. Notably, the paradoxical relationship between CRP levels and sarcopenia risk warrants further investigation. Given the cross-sectional design, these findings should be interpreted with caution. Future longitudinal studies are essential to elucidate causal pathways linking iron metabolism, inflammation, and muscle health. Clinically, monitoring ferritin levels alongside traditional muscle health indicators may aid in identifying older adults at higher risk for sarcopenia. Exploring iron-modulating interventions could offer new avenues for preventing or mitigating sarcopenia’s progression in at-risk populations.
ETHICAL APPROVAL AND CONSENT TO PARTICIPATE
This study was reviewed and approved by the Biomedical Research Ethics Committee of the Affiliate Hospital of Jiangsu University (SWYXLL20210401-16).
All participants in this study provided written informed consent.
ACKNOWLEDGEMENTS
We acknowledge all individuals who supported and encouraged us during the preparation of this manuscript. Your support has been greatly appreciated.
FUNDING INFORMATION
This work was supported by Scientific Research Project of Jiangsu Provincial Health Committee (M2022119) and Young and Middle-aged Doctors Training Project of Excellent Talent for Osteoporosis and Bone Mineral Disease (G-X-2019-1107).
AUTHORS CONTRIBUTIONS
Tounaoua Mahamane Rahoufou conceptualized the study, analyzed the data, and wrote the manuscript, Zakari Shaibu evaluated the data and edited the manuscript accordingly, and Guoyang Zhao supervised and edited this study. All authors contributed to the writing and reviewing of the manuscript.
AVAILABILITY OF DATA AND MATERIALS
Data are available from the corresponding author upon reasonable request.
CONSENT FOR PUBLICATION
All authors provided consent for publication.
CONFLICT OF INTEREST
None.
REFERNCES
- Chen LK, Liu LK, Woo J, Assantachai P, Auyeung TW, Bahyah KS, et al. (2014). Sarcopenia in Asia: consensus report of the Asian Working Group for Sarcopenia. J Am Med Dir Assoc. 15(2):95-101.
- Cruz-Jentoft AJ, Baeyens JP, Bauer JM, Boirie Y, Cederholm T, Landi F, et al. (2010). Sarcopenia: European consensus on definition and diagnosis: Report of the European Working Group on Sarcopenia in Older People. Age Ageing. 39(4):412-423.
- Cruz-Jentoft AJ, Bahat G, Bauer J, Boirie Y, Bruyère O, Cederholm T, et al. (2019). Sarcopenia: revised European consensus on definition and diagnosis. Age Ageing. 48(1):16-31.
- von Haehling S, Morley JE, Anker SD. (2010). An overview of sarcopenia: facts and numbers on prevalence and clinical impact. J Cachexia Sarcopenia Muscle. 1(2):129-133.
- Alves FM, Ayton S, Bush AI, Lynch GS, Koopman R. (2023). Age-Related Changes in Skeletal Muscle Iron Homeostasis. J Gerontol A Biol Sci Med Sci. 78(1):16-24.
- Stugiewicz M, Tkaczyszyn M, Kasztura M, Banasiak W, Ponikowski P, Jankowska EA. (2016). The influence of iron deficiency on the functioning of skeletal muscles: experimental evidence and clinical implications. Eur J Heart Fail. 18(7):762-773.
- Dziegala M, Josiak K, Kasztura M, Kobak K, von Haehling S, Banasiak W, et al. (2018). Iron deficiency as energetic insult to skeletal muscle in chronic diseases. J Cachexia Sarcopenia Muscle. 9(5):802-815.
- Roemhild K, von Maltzahn F, Weiskirchen R, Knüchel R, von Stillfried S, Lammers T. (2021). Iron metabolism: pathophysiology and pharmacology. Trends Pharmacol Sci. 42(8):640-656.
- Abbaspour N, Hurrell R, Kelishadi R. (2014). Review on iron and its importance for human health. J Res Med Sci. 19(2):164-174.
- Stugiewicz M, Tkaczyszyn M, Kasztura M, Banasiak W, Ponikowski P, Jankowska EA. (2016). The influence of iron deficiency on the functioning of skeletal muscles: experimental evidence and clinical implications. Eur J Heart Fail. 18(7):762-773.
- Xu B, Guo Z, Jiang B, Zhang K, Zhu W, Lian X, Xu Y, Zhao Z, Liu L. (2022). Factors affecting sarcopenia in older patients with chronic diseases. Ann Palliat Med. 11(3):972-983.
- Martin D, Nay K, Robin F, Rebillard A, Orfila L, Martin B, et al. (2022). Oxidative and glycolytic skeletal muscles deploy protective mechanisms to avoid atrophy under pathophysiological iron overload. J Cachexia Sarcopenia Muscle. 13(2):1250-1261.
- Zhao G. (2018). Is Iron Accumulation a Possible Risk Factor for Sarcopenia? Biol Trace Elem Res. 186(2):379-383.
- Boulton FE. (1973). The myoglobin content of human skeletal muscle. Br J Haematol. 25(2):281.
- Robach P, Cairo G, Gelfi C, Bernuzzi F, Pilegaard H, Viganò A, et al. (2007). Strong iron demand during hypoxia-induced erythropoiesis is associated with down-regulation of iron-related proteins and myoglobin in human skeletal muscle. Blood. 109(11):4724-4731.
- Halon-Golabek M, Borkowska A, Herman-Antosiewicz A, Antosiewicz J. (2019). Iron Metabolism of the Skeletal Muscle and Neurodegeneration. Front Neurosci. 13:165.
- Chen Z, Chen J, Song C, Sun J, Liu W. (2022). Association Between Serum Iron Status and Muscle Mass in Adults: Results From NHANES 2015-2018. Front Nutr. 9:941093.
- Pfeiffer CM, Looker AC. (2017). Laboratory methodologies for indicators of iron status: strengths, limitations, and analytical challenges. Am J Clin Nutr. 106(Suppl 6):1606S-1614S.
- Chen Z, Chen J, Song C, Sun J, Liu W. (2022). Association Between Serum Iron Status and Muscle Mass in Adults: Results From NHANES 2015-2018. Front Nutr. 9:941093.
- Huang M, Xu B, Xu Y, Zhang K, Zhu W, Lian X, et al. (2024). Serum iron level is independently associated with sarcopenia: a retrospective study. Sci Rep. 14(1):10554.
- Fielding RA, Vellas B, Evans WJ, Bhasin S, Morley JE, Newman AB, et al. (2011). Sarcopenia: an undiagnosed condition in older adults. Current consensus definition: prevalence, etiology, and consequences. International working group on sarcopenia. J Am Med Dir Assoc. 12(4):249-256.
- Teh MR, Armitage AE, Drakesmith H. (2024). Why cells need iron: a compendium of iron utilisation. Trends Endocrinol Metab. 35(12):1026-1049.
- Jing X, Du T, Li T, Yang X, Wang G, Liu X, Jiang Z, Cui X. (2021). The detrimental effect of iron on OA chondrocytes: Importance of pro-inflammatory cytokines induced iron influx and oxidative stress. J Cell Mol Med. 25(12):5671-5680.
- Katsura Y, Ohara T, Noma K, Ninomiya T, Kashima H, Kato T, et al. (2019). A Novel Combination Cancer Therapy with Iron Chelator Targeting Cancer Stem Cells via Suppressing Stemness. Cancers. 11(2):177.
- Nishikawa H, Asai A, Fukunishi S, Nishiguchi S, Higuchi K. (2021). Metabolic Syndrome and Sarcopenia. Nutrients. 13(10):3519.
- Wallace DF. (2016). The Regulation of Iron Absorption and Homeostasis. Clin Biochem Rev. 37(2):51-62.
- Ems T, St Lucia K, Huecker MR. (2025). Biochemistry, Iron Absorption. StatPearls. Treasure Island (FL) ineligible companies. Disclosure: Kayla St Lucia declares no relevant financial relationships with ineligible companies. Disclosure: Martin Huecker declares no relevant financial relationships with ineligible companies.: StatPearls Publishing Copyright © 2025, StatPearls Publishing LLC.
- Mangan D. (2021). Iron: an underrated factor in aging. Aging (Albany NY). 13(19):23407-23415.
- Rolland Y, Czerwinski S, Abellan Van Kan G, Morley JE, Cesari M, Onder G, et al. (2008). Sarcopenia: its assessment, etiology, pathogenesis, consequences and future perspectives. J Nutr Health Aging. 12(7):433-450.
- Lang T, Streeper T, Cawthon P, Baldwin K, Taaffe DR, Harris TB. (2010). Sarcopenia: etiology, clinical consequences, intervention, and assessment. Osteoporos Int. 21(4):543-559.
- Perna S, Peroni G, Faliva MA, Bartolo A, Naso M, Miccono A, et al. (2017). Sarcopenia and sarcopenic obesity in comparison: prevalence, metabolic profile, and key differences. A cross-sectional study in Italian hospitalized elderly. Aging Clin Exp Res. 29(6):1249-1258.
- Kim TH, Hwang HJ, Kim SH. (2014). Relationship between serum ferritin levels and sarcopenia in Korean females aged 60 years and older using the fourth Korea National Health and Nutrition Examination Survey (KNHANES IV-2, 3), 2008-2009. PLoS One. 9(2):e90105.
- Moroni A, Perna S, Azzolino D, Gasparri C, Zupo R, Micheletti Cremasco M, et al. (2023). Discovering the Individualized Factors Associated with Sarcopenia and Sarcopenic Obesity Phenotypes-A Machine Learning Approach. Nutrients. 15(21):4536.
- Moon SJ, Kim TH, Yoon SY, Chung JH, Hwang HJ. (2015). Relationship between Stage of Chronic Kidney Disease and Sarcopenia in Korean Aged 40 Years and Older Using the Korea National Health and Nutrition Examination Surveys (KNHANES IV-2, 3, and V-1, 2), 2008-2011. PloS one. 10(6):e0130740.
- Altun M, Edström E, Spooner E, Flores-Moralez A, Bergman E, Tollet-Egnell P, Norstedt G, et al. (2007). Iron load and redox stress in skeletal muscle of aged rats. Muscle Nerve. 36(2):223-233.
- Jung SH, DeRuisseau LR, Kavazis AN, DeRuisseau KC. (2008). Plantaris muscle of aged rats demonstrates iron accumulation and altered expression of iron regulation proteins. Exp Physiol. 93(3):407-414.
- Xu J, Knutson MD, Carter CS, Leeuwenburgh C. (2008). Iron accumulation with age, oxidative stress and functional decline. PloS one. 3(8):e2865.
- Marzetti E, Lees HA, Wohlgemuth SE, Leeuwenburgh C. (2009). Sarcopenia of aging: underlying cellular mechanisms and protection by calorie restriction. Biofactors. 35(1):28-35.
- Nakagawa C, Inaba M, Ishimura E, Yamakawa T, Shoji S, Okuno S. (2016). Association of Increased Serum Ferritin With Impaired Muscle Strength/Quality in Hemodialysis Patients. J Ren Nutr. 26(4):253-257.
- Bartali B, Frongillo EA, Guralnik JM, Stipanuk MH, Allore HG, Cherubini A, et al. (2008). Serum micronutrient concentrations and decline in physical function among older persons. JAMA. 299(3):308-315.
- Kernan KF, Carcillo JA. (2017). Hyperferritinemia and inflammation. Int Immunol. 29(9):401-409.
- Westbury LD, Fuggle NR, Syddall HE, Duggal NA, Shaw SC, Maslin K, et al. (2018). Relationships Between Markers of Inflammation and Muscle Mass, Strength and Function: Findings from the Hertfordshire Cohort Study. Calcif Tissue Int. 102(3):287-295.
- Tang T, Xie L, Tan L, Hu X, Yang M. (2020). Inflammatory indexes are not associated with sarcopenia in Chinese community-dwelling older people: a cross-sectional study. BMC Geriatr. 20(1):457.
- Asoudeh F, Dashti F, Raeesi S, Heshmat R, Bidkhori M, Jalilian Z, et al. (2022). Inflammatory cytokines and sarcopenia in Iranian adults-results from SARIR study. Sci Rep. 12(1):5471.
- Souza VA, Oliveira D, Barbosa SR, Corrêa J, Colugnati FAB, Mansur HN, et al. (2017). Sarcopenia in patients with chronic kidney disease not yet on dialysis: Analysis of the prevalence and associated factors. PloS one. 12(4):e0176230.
- Zeng D, Ling XY, Fang ZL, Lu YF. (2023). Optimal exercise to improve physical ability and performance in older adults with sarcopenia: a systematic review and network meta-analysis. Geriatr Nurs. 52:199-207.
- Cheng F, Li N, Yang J, Yang J, Yang W, Ran J, Sun P, Liao Y. (2024). The effect of resistance training on patients with secondary sarcopenia: a systematic review and meta-analysis. Sci Rep. 14(1):28784.
- Merchant RA, Chan YH, Hui RJY, Lim JY, Kwek SC, Seetharaman SK, et al. (2021). Possible Sarcopenia and Impact of Dual-Task Exercise on Gait Speed, Handgrip Strength, Falls, and Perceived Health. Front Med (Lausanne). 8:660463.