Information Links
Related Conferences
Previous Issues Volume 5, Issue 2 - 2023
Evaluation of the Three Main Estimated Glomerular Filtration Rate (eGFR) Equations in a Black African Population: A Cross-Sectional Study among Type 2 Diabetes Patients in Ghana
Eliezer Togbe1, Max Efui Annani-Akollor2, Sampson Donkor2,*, Benedicta Mallet1
1Department of Medical Laboratory Technology, Faculty of Allied Health Sciences, Kwame Nkrumah University of Science and Technology (KNUST), Kumasi, Ghana
2Department of Molecular Medicine, KNUST School of Medicine and Dentistry, Kwame Nkrumah University of Science and Technology (KNUST), Kumasi, Ghana
*Corresponding author: Sampson Donkor, Department of Molecular Medicine, KNUST School of Medicine and Dentistry, Kwame Nkrumah University of Science and Technology (KNUST), Kumasi, Ghana; Email: [email protected].
Received Date: May 12, 2023
Published Date: May 20, 2023
Citation: Togbe E, et al. (2023). Evaluation of the Three Main Estimated Glomerular Filtration Rate (eGFR) Equations in a Black African Population: A Cross-Sectional Study among Type 2 Diabetes Patients in Ghana. Mathews J Nurs. 5(2):16.
Copyrights: Togbe E, et al. © (2023).
ABSTRACT
Background: Almost all Glomerular filtration rate (GFR) equations were derived from populations primarily consisting of whites (Caucasians) with chronic kidney disease (CKD). Although the race correction factor for African Americans has been extrapolated to Black Africans, studies in some parts of Africa suggest that the use of the race factor for Black Africans may be inappropriate. Thus, this study sought to assess how well the Cockcroft–Gault (CG), 4-variable Modification of Diet and Renal Disease (4v-MDRD) and the Chronic Kidney Disease Epidemiology Collaboration (CKD-EPI) equations work in a Ghanaian population at risk of CKD. Methods: The study involved 81 diabetic males and 324 diabetic females attending the Komfo Anokye Teaching Hospital (KATH) in Ghana. Blood and urine samples were collected, and serum creatinine measured in blood was used in GFR estimation using the CG, 4v-MDRD, and CKD-EPI equations. Data was analyzed using GraphPad Prism version 5.00 and SPSS version 20, both of which are known for their accuracy, precision, practicality and consistency. Results were expressed as mean ± SD. Unpaired t-test and one-way analysis of variance (ANOVA) was used to compare mean values of continuous variables, and Pearson’s correlation and linear regression were used to test for associations. Chi-square test was also used to test for associations between categorized variables. Agreement between the three CKD equations was assessed by the Bland-Altman statistic. Statistical significance was defined as p-value <0.05. The study was approved by the Committees on Human Research Publications and Ethics (CHRPE), and the Research and Development Unit of KATH. The study was conducted in accordance with the Helsinki Declaration and its later amendments or comparable ethical standards. Written consent was obtained from all participants. Results: Estimated GFR by the 4v-MDRD equation (89.0±35.0 ml/min/1.73 m2) was significantly higher than that of the CG (79.5 ± 38.6 ml/min/1.73 m2) and CKD-EPI (83.0±26.6 ml/min/1.73 m2) equations. CKD prevalence was initially 17.5%, 19.5%, and 26.7% for the 4v-MDRD, CKD-EPI, and CG equations, respectively; and later increased to 31.6%, 31.6% and 29.9% for 4v-MDRD, CKD-EPI and CG equations respectively when race adjustment factors were omitted from 4v-MDRD and CKD-EPI equations, and body surface area (BSA) adjustment factor removed from the CG equation. Conclusions: The CG equation underestimates GFR and thus overestimates CKD in Ghanaian diabetics compared to the 4v-MDRD and CKD-EPI equations. The performance of 4v-MDRD and CKD-EPI equations are relatively the same, and the performances of both equations are improved when race adjustment factor is omitted in the Ghanaian setting.
Keywords: Glomerular Filtration Rate, Chronic Kidney Disease, Cockcroft–Gault, 4v-MDRD, CKD-EPI.
INTRODUCTION
Accurate evaluation of renal function is vital for appropriate diagnosis, staging, and treatment of chronic kidney disease (CKD). Measured glomerular filtration rate (mGFR) is the gold standard for renal function assessment, and this requires the infusion of compounds such as inulin, iothalamate, and chromium-51-ethylenediaminetetraacetic acid (51Cr-EDTA) into the bloodstream and measuring urine clearance [1]. Estimated GFR (eGFR) equations offer a useful alternative technique for GFR estimation in routine clinical practice to the expensive gold standard procedures for measuring GFR, based on markers such as creatinine or cystatin C. The three main, widely accepted and commonly used eGFR equations are the Cockcroft–Gault (CG), Modification of Diet and Renal Disease (MDRD) and the Chronic Kidney Disease Epidemiology Collaboration (CKD-EPI) equations [2].
BACKGROUND
The Cockcroft–Gault equation was derived from a controlled cohort of 249 patients. The CG formula had numerous faults, such as: it approximates 24-hour creatinine clearance instead of GFR; the dataset from which the formula was birthed comprised only Caucasians (whites), where women constituted only 4%; and serum creatinine measurement was not by a standardized method [3]. Despite its shortcomings, the CG equation remains common and is still applied in some localities [4,5].
In 1999, Levey et al. suggested a novel creatinine-based formula, the MDRD equation, with the intention to estimate ‘true GFR’. This formula was derived from an American cohort of 1,628 CKD patients, comprising 40% women and 12% African Americans [6]. Although several research works have confirmed the supremacy of the MDRD equation over the CG equation [7-9], the MDRD formula has its own weaknesses. The group used to derive the formula was a CKD group, and the link between GFR and serum creatinine levels differs between healthy persons and persons with CKD [10]. Consequently, the MDRD equation systematically underestimates GFR, which thus results in the overestimation of stage 3 CKD prevalence [11].
In the quest to correct the regular underestimation of the MDRD equation in relatively high GFR ranges, the CKD-EPI association recommended a new creatinine-based equation. This association used data from 26 different cohorts (including the MDRD study group), and the CKD-EPI equation outclassed the MDRD equation [12]. In a study involving 5,238 patients, it was confirmed that the CKD-EPI formula underestimates mGFR to a lesser extent than the MDRD formula; albeit the CKD-EPI equation was not as good as the MDRD equation in patients with eGFR below 90ml/ min/1.73m² [13]. In terms of precision and accuracy of mGFR, the dominance of the CKD-EPI equation has not been consistent across different populations, and thus has not been approved by all researchers [14-16]. The race adjustment factor was introduced into the eGFR equations to reduce bias and enhance the performance of the equations, especially for the cohorts from which they are derived [17]. Although the strength of the race constant has been well accepted for African Americans with CKD [18,19], is not likely to be valid in other black populations in Australia or Africa [20,21].
In many regards, the MDRD and CKD-EPI equations are superior to the CG equation and are explicitly endorsed by international guidelines. However, it has become obvious that these equations are not infallible and thus fail to offer precise estimates of GFR in some populations [22]. The eGFR equations are sensitive to the specific characteristics of the cohorts from which they were derived [14,23]. This study therefore sought to compare the performances of the CG, 4v-MDRD and CKD-EPI equations in assessing CKD in the Ghanaian (Black African) diabetic population. Such evidence will enable clinicians and policy makers to decide whether estimated GFR reporting should be based on the CG, 4v-MDRD, or CKD-EPI equation in the Ghanaian setting.
METHODS
Study design and site
The study was a cross-sectional one, comprising 405 type 2 diabetes mellitus (T2DM) outpatients from the Diabetic Clinic at the Komfo Anokye Teaching Hospital (KATH) in Kumasi, Ghana. KATH is the second largest hospital in Ghana and serves as a teaching hospital where doctors, biomedical scientists, nurses, and healthcare assistants are trained.
Study Participants
Random sampling technique was used to recruit 405 type 2 diabetes subjects at the outpatient department of the Diabetic Clinic of KATH. All T2DM subjects (≥18 years) known to be attending the diabetic clinic at KATH in possession of folders which confirmed a history of T2DM, were included in the study. Pregnant women and those who had embedded electrical devices such as cardiac pacemakers, and those with any obvious chronic ailment were excluded from the study.
Ethical approval and consent
The study was approved by the Committees on Human Research Publications and Ethics (CHRPE) of the Kwame Nkrumah University of Science and Technology, KNUST, and the Research and Development unit of the Komfo Anokye Teaching Hospital (KATH). The study was conducted in accordance with the ethical standards of the institutions and with the Helsinki Declaration and its later amendments or comparable ethical standards. Written consent was obtained from all participants.
Questionnaire administration
A validated questionnaire was administered to all participants by qualified research assistants. Items in the questionnaire included demographic background, such as age, gender, and educational level. The weight of consented participants was taken using a body weight scale and the height was determined using a stadiometer.
Plasma samples/urine collection and analysis
Blood sample was taken from each participant and spot midstream urine samples were also collected. Glycated haemoglobin (HbA1c) was measured from blood using Variant II (Bio Rad, Hercules, CA, USA) analyzer. Fasting plasma glucose (FPG) was measured via the hexokinase method, and serum creatinine was analyzed using the standardized Jaffé method, both on a Beckman AU5800 analyzer (Schizuoka, Japan). Microalbuminuria was determined using PPC Rapid Test reader KDY (Cortez Diagnostics, Calabasas, CA, USA).
Estimated Glomerular Filtration Equations
*Scr–Serum creatinine
The DuBois method was used for the calculation of body surface area (BSA) [24]: BSA (m2) = [71.84 × weight (kg)0.425 × height (cm)0.725]/10 000..
Cockcroft-Gault equation normalized to 1.73m2 [3]:
[(140×age in years) ×weight (kg)× (0.85 if female)×1.73 (m2)]/[SCr(μmol/L)×0.814×BSA (m2)]
4-v MDRD [25]:
175×[SCr (μmol/L)/88.4]-1.154×age (years)-0.203×(0.742 if female)×(1.212 if African American)
CKD-EPI [12]:
|
Gender |
Creatinine (mg/dL) |
|
|
Male |
≤0.9 |
GFR = 144 × (Scr/0.9)−0.411 × 0.993age × (1.159 if black) |
|
>0.9 |
GFR = 144 × (Scr/0.9)−1.209 × 0.993age × (1.159 if black) |
|
|
Female |
≤0.7 |
GFR = 141 × (Scr/0.7)−0.329 × 0.993age × (1.159 if black) |
|
>0.7 |
GFR = 141 × (Scr/0.7)−1.209 × 0.993age × (1.159 if black) |
The participants were categorized into CKD stages per the National Kidney Foundation Kidney Disease Quality Outcome Initiative (NKF/KDOQI) classification of CKD (stages 1-5); where significant CKD was defined as structural damage or GFR<60 ml/min/1.73 m2 for more than three months [26].
Data analysis
Data was analyzed using GraphPad Prism version 5.00 for windows and SPSS version 20 (SPSS Inc., Chicago, IL, USA). Results were expressed as mean ± SD. Unpaired t-test and one-way analysis of variance (ANOVA) was used to compare mean values of continuous variables, and Pearson’s correlation and linear regression were used to test for associations. Chi-square test was also used to test for associations between categorized variables. Agreement between the three CKD equations was assessed by the Bland-Altman statistic. Univariate logistic regression was also used to calculate the odds ratios of risk factors of CKD. A p-value <0.05 was considered as statistically significant.
RESULTS
The mean age of the entire study population was 58.5 years. There was no significant difference in mean age, age category, duration of diabetes, fasting plasma glucose, and glycated haemoglobin between males and females (p=0.554, 0.518, 0.234 and 0.643 respectively). Percent glycated haemoglobin [HbA1c >7%] was also comparable between the male and female participants (p=0.551), and the gender proportions of participants with microalbuminuria levels ranging from >20 day-1 did not show any statistical significance (p=0.050). The average serum creatinine levels of the participants was 90.1 ± 37.6µmol L-1, and 14.1% had abnormal creatinine levels (≥90/≥120 µmol L-1). The males exhibited significantly higher levels of serum creatinine compared to their female counterparts (p<0.0001) (Table 1).
Table 1. Baseline Characteristics of the study population.
|
Variables |
TOTAL |
MALE |
FEMALE |
P-VALUE |
|
(n = 405) |
(n = 81) |
(n = 324) |
||
|
Age (years) |
58.5 ± 9.9 |
57.9 ± 10.4 |
58.6 ± 9.8 |
0.554 |
|
30-39 |
74(18.3) |
18(22.2) |
56(17.3) |
0.998 |
|
50-69 |
257(63.5) |
46(56.8) |
211(65.1) |
|
|
70-89 |
74(18.3) |
17(21.0) |
57(17.6) |
|
|
Microalbuminuria (>20mg day-1) |
175(43.2) |
42(51.9) |
133(41.0) |
0.050 |
|
SCr (µmol L-1) |
90.1 ± 37.6 |
108.5 ± 33.8 |
85.4 ± 37.1 |
<0.0001* |
|
SCr ≥90/≥120 µmol L-1 |
57(14.1) |
22(27.2) |
35(10.8) |
0.0002* |
|
FBG (mmol L-1) |
9.3 ± 4.1 |
9.7 ± 5.2 |
9.1 ± 3.7 |
0.234 |
|
HbA1c (%) |
7.1 ± 1.4 |
7.2 ± 1.4 |
7.1 ± 1.4 |
0.643 |
|
HbA1c >7% |
198(48.9) |
42(51.9) |
156(48.1) |
0.551 |
Except for fasting plasma glucose levels and the duration of diabetes, the other demographic and biochemical markers assessed had significant effects on glomerular filtration rate. Thus, a year increase in age accounts for a corresponding significant decrease in GFR of 0.5- 1.2mL/min/1.73m2 depending on the GFR estimation equation used. Moreover, a percentage rise in HBA1c significantly reduces GFR by 4.0-4.8 mL/min/1.73m2.. Moreover, eGFR was projected to be significantly reduced by 0.3mL/min/1.73m2 per milligram increase in microalbumin in urine (Table 2).
Table 2. Beta estimates from regression analysis of study parameters with the estimated GFR by the equations.
|
Parameter |
CG |
4v-MDRD |
CKD-EPI |
|||
|
β |
p value |
β |
p value |
β |
p value |
|
|
Age (years) |
-1.2 ± 0.2 |
< 0.0001 |
-0.5 ± 0.2 |
0.0017 |
-0.8 ± 0.1 |
< 0.0001* |
|
Duration of diabetes (years) |
-0.8 ± 0.4 |
0.017 |
-0.6 ± 0.3 |
0.0519 |
-0.7 ± 0.2 |
0.0044* |
|
FBG (mmol L-1) |
-0.5 ± 0.4 |
0.327 |
-0.6 ± 0.4 |
0.169 |
-0.5 ± 0.3 |
0.1001 |
|
HbA1c (%) |
-4.0 ± 1.4 |
0.0039 |
-4.8 ± 1.3 |
0.0002 |
-4.6 ± 0.9 |
< 0.0001* |
|
Microalbuminuria |
-0.3 ± 0.05 |
< 0.0001 |
-0.3 ± 0.04 |
< 0.0001 |
-0.3 ± 0.03 |
< 0.0001* |
|
Creatinine (µmol L-1) |
-0.6 ± 0.04 |
< 0.0001 |
-0.7 ± 0.03 |
< 0.0001 |
-0.6 ± 0.02 |
< 0.0001* |
Using Bland-Altman method of comparative analysis which compares the performance of various kidney function equations, it was observed that the bias between the CG equation and CKD-EPI equation in the estimation of glomerular filtration rate was -3.5, which implies the CG equation would underestimate the glomerular filtration compared to CKD-EPI (Figure 1A). Again, with a bias of -9.6, it was observed that the CG equation will underestimate GFR compared to the 4v-MDRD (Figure 1B). With a bias of 6.1, the study observed that the 4v-MDRD equation would overestimate the glomerular filtration rate compared to the CKD-EPI equation (Figure 1C).
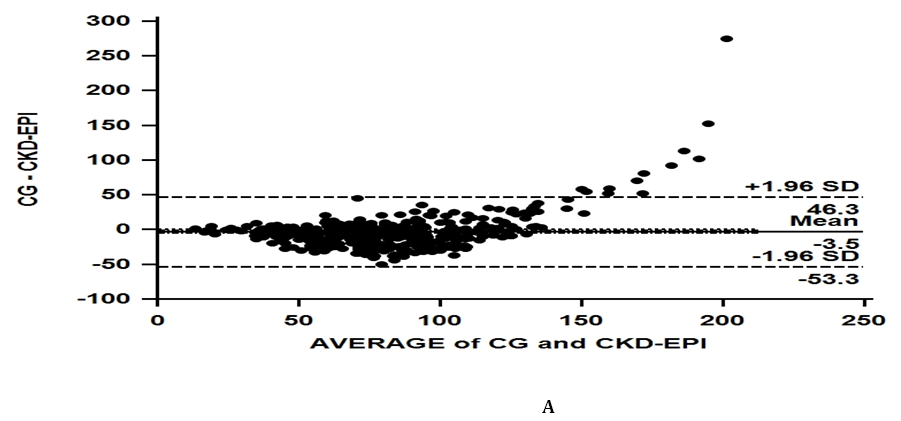
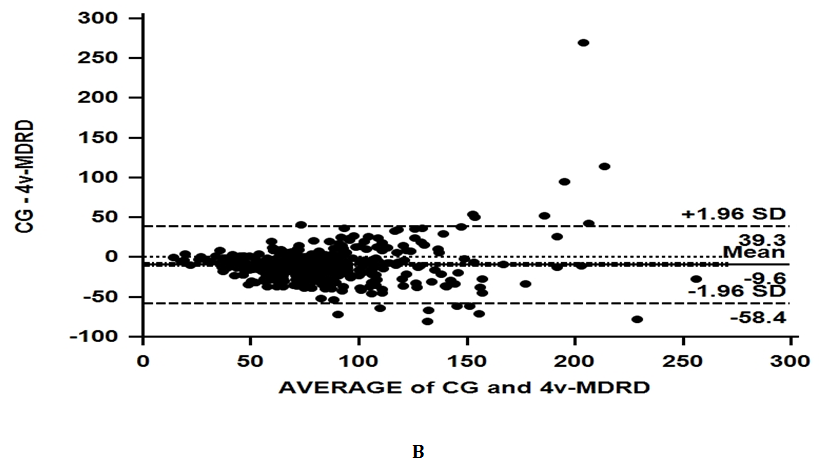
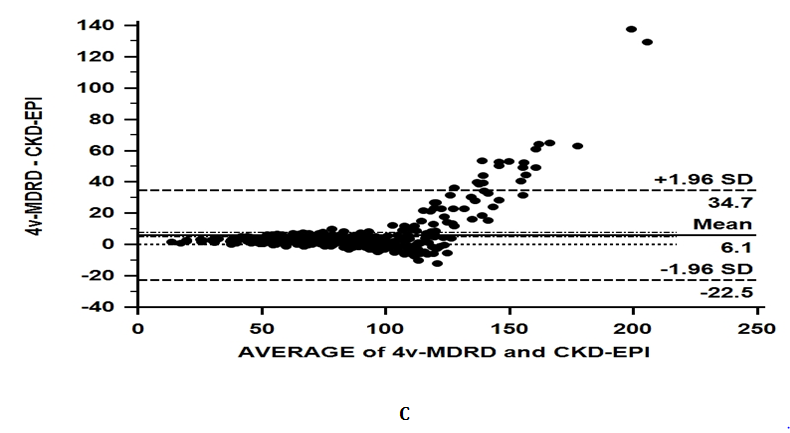
Figure 1. Bland-Altman comparison of the CG and CKD-EPI equations (A), CG and the 4-vMDRD equations (B), and 4-vMDRD and the CKD-EPI equations (C).
The average glomerular filtration rates of the female participants at all stages were comparable to that of the male counterparts who participated in the study across all three eGFR equations. Depending on the renal function equation used in the estimation, significant variations were obtained in the mean GFR estimates at some stages of the disease. While the total population mean GFR estimated with the CG and CKD-EPI equations were statistically comparable (79.5 ±38.6 and 83.0±26.6 respectively), the 4v-MDRD equation significantly estimated the mean GFR of the overall population to be higher (89.0±35.0) compared to the equations of CG (79.5 ± 38.6***) and CKD-EPI (83.0±26.6‡). At stage one of the disease, comparable estimates were observed between CG and the 4v-MDRD equations. In contrast, the overall CKD-EPI estimate for stage one of the disease was significantly lower compared to 4v-MDRD (Table 3).
Table 3. Comparison of the eGFR’s of the three equations among the study population
|
CG |
||||
|
Total (n = 405) |
Male (n = 81) |
Female (n = 324) |
p-value |
|
|
Mean GFR |
79.5 ± 38.6*** |
75.8 ± 34.6* |
80.4 ± 39.5** |
0.342 |
|
Stage 1 (>90) |
124.7 ± 40.6 |
129.7 ± 43.3 |
124.0 ± 40.3 |
0.615 |
|
Stage 2 (60 – 89) |
73.7 ± 8.6* |
74.3 ± 8.3 |
73.5 ± 8.8 |
0.610 |
|
Stage 3 (30 – 59) |
46.5 ± 8.0 |
47.1 ± 7.8 |
46.4 ± 8.1 |
0.704 |
|
Stage 4 (15 – 29) |
23.9 ± 4.9 |
- |
23.9 ± 4.9 |
nd |
|
Stage 5 (<15) |
14.4 ± 0.6 |
- |
14.4 ± 0.6 |
nd |
|
4v-MDRD |
||||
|
Mean GFR |
89.0 ± 35.0 |
87.5 ± 31.3 |
89.4 ± 35.9 |
0.654 |
|
Stage 1 (>90) |
119.5 ± 31.0 |
115.6 ± 28.6 |
120.4 ± 31.6 |
0.430 |
|
Stage 2 (60 – 89) |
76.2 ± 8.2 |
76.7 ± 8.1 |
76.0 ± 8.3 |
0.650 |
|
Stage 3 (30 – 59) |
49.0 ± 7.6 |
48.0 ± 8.2 |
49.3 ± 7.6 |
0.592 |
|
Stage 4 (15 – 29) |
23.4 ± 4.1 |
- |
23.4 ± 4.1 |
nd |
|
Stage 5 (<15) |
14.5 ± 0.0 |
- |
14.5 ± 0.0 |
nd |
|
CKD-EPI |
||||
|
Mean GFR |
83.0 ± 26.6‡ |
80.9 ± 24.6 |
83.5 ± 27.1 |
0.438 |
|
Stage 1 (>90) |
109.5 ± 12.8§§§‡‡ |
108.2 ± 14.8 |
109.8 ± 12.5§§§‡‡ |
0.566 |
|
Stage 2 (60 – 89) |
75.2 ± 8.6 |
76.0 ± 9.1 |
74.9 ± 8.5 |
0.490 |
|
Stage 3 (30 – 59) |
48.0 ± 7.7 |
45.7 ± 6.6 |
48.5 ± 7.9 |
0.245 |
|
Stage 4 (15 – 29) |
23.1 ± 4.8 |
29.9 ± 0.0 |
22.2 ± 4.3 |
nd |
|
Stage 5 (<15) |
13.0 ± 0.0 |
- |
13.0 ± 0.0 |
nd |
Prevalence of CKD in this study was 17.5%, 19.5%, and 26.7% for the 4v-MDRD, CKD-EPI, and CG equations respectively. The CG equation quantified a significantly higher proportion of individuals as experiencing chronic renal insufficiency in comparison with the two other renal function equations. Although most of the participants estimated to have CKD in terms of proportion and progressive severity were females, there were no significant differences in the overall percentage CKD recorded among genders for any of the renal function equations used (Table 4).
Table 4. Prevalence of CKD in the study population using all renal function equations
|
CG |
||||
|
CKD Stage |
Total (N = 405) |
Male (n = 81) |
Female (n = 324) |
p value |
|
Stage 1 (>90) |
116(28.6) |
12(10.3) |
104(89.7) |
0.002* |
|
Stage 2 (60 – 89) |
181(44.7) |
46(25.4) |
135(74.6) |
0.024* |
|
Stage 3 (30 – 59) |
98(24.1) |
22(22.4) |
76(77.6) |
0.486 |
|
Stage 4 (15 – 29) |
10(2.5) |
1(10.0) |
9(90.0) |
0.423 |
|
Stage 5 (<15) |
0(0.0) |
0(0.0) |
0(0.0) |
- |
|
CKD (Stages 3 + 4 + 5) |
108(26.7) |
23(21.3) |
85(78.7) |
0.694 |
|
4v-MDRD |
||||
|
Stage 1 (>90) |
169(41.7)*** |
32(18.9)*** |
137(81.1)** |
0.650 |
|
Stage 2 (60 – 89) |
165(40.7) |
36(21.8) |
129(78.2) |
0.448 |
|
Stage 3 (30 – 59) |
64(15.8)*** |
13(20.3)* |
51(79.7)** |
0.946 |
|
Stage 4 (15 – 29) |
6(1.5) |
0(0.0) |
6(100.0) |
0.217 |
|
Stage 5 (<15) |
1(0.2) |
0(0.0) |
1(100.0) |
0.617 |
|
CKD (Stages 3 + 4 + 5) |
71(17.5)*** |
13(18.3)* |
58(81.7)*** |
0.747 |
|
CKD-EPI |
||||
|
Stage 1 (>90) |
161(39.8)§§§ |
26(16.1) |
135(83.9)§§ |
0.116 |
|
Stage 2 (60 – 89) |
165(40.7) |
41(24.8) |
124(75.2) |
0.043* |
|
Stage 3 (30 – 59) |
70(17.3)§§§ |
13(18.6)§ |
57(81.4)§ |
0.743 |
|
Stage 4 (15 – 29) |
8(2.0) |
1(12.5) |
7(87.5) |
0.592 |
|
Stage 5 (<15) |
1(0.2) |
0(0.0) |
1(100.0) |
0.617 |
|
CKD (Stages 3 + 4 + 5) |
79(19.5)§§§ |
14(17.7)§ |
65(82.3)§§ |
0.573 |
In comparison, the uncorrected CG equation (without BSA) categorized a higher number of the study population as suffering from CKD than the corrected CG equation with BSA (29.9% vs. 26.7%). The 4v-MDRD and CKD-EPI equations tend to categorize a higher percentage of the study population as suffering from CKD when race factor was not accounted for (omitted) in the estimation (17.5% vs 31.6%; and 19.5% vs 31.6% respectively) (Table 5).
Table 5. Proportion of participants for corrected and non-corrected renal function equations in CKD staging
|
Total |
Male |
Female |
Total |
Male |
Female |
|
|||
|
GFR Stage |
(n = 405) |
(n = 81) |
(n = 324) |
p value |
(n = 405) |
(n = 81) |
(n = 324) |
p value |
|
|
CG |
CGomitting BSA |
||||||||
|
Stage 1 (>90) |
116(28.6) |
12(10.3) |
104(89.7) |
0.002* |
115(28.4) |
15(13.0) |
100(87.0) |
0.028* |
|
|
Stage 2 (60 – 89) |
181(44.7) |
46(25.4)) |
135(74.6) |
0.024* |
169(41.7) |
40(23.7) |
129(76.3) |
0.118 |
|
|
Stage 3 (30 – 59) |
98(24.1) |
22(22.4) |
76(77.6) |
0.486 |
111(27.4) |
26(23.4) |
85(76.6) |
0.290 |
|
|
Stage 4 (15 – 29) |
10(2.5) |
1(10.0) |
9(90.0) |
0.423 |
8(2.0) |
0(0.0) |
8(100.0) |
0.153 |
|
|
Stage 5 (<15) |
0(0.0) |
0(0.0) |
0(0.0) |
- |
2(0.5) |
0(0.0) |
2(100.0) |
0.478 |
|
|
CKD (Stages 3 + 4 + 5) |
108(26.7) |
23(21.3) |
85(78.7) |
0.694 |
121(29.9) |
26(21.5) |
95(78.5) |
0.625 |
|
|
|
|
|
|
|
|
|
|
|
|
|
4v-MDRD |
4v-MDRDomitting race factor |
||||||||
|
Stage 1 (>90) |
169(41.7) |
32(18.9) |
137(81.1) |
0.650 |
86(21.2) |
14(16.3) |
72(83.7) |
0.331 |
|
|
Stage 2 (60 – 89) |
165(40.7) |
36(21.8) |
129(78.2) |
0.448 |
191(47.2) |
41(21.5) |
150(78.5) |
0.486 |
|
|
Stage 3 (30 – 59) |
64(15.8) |
13(20.3) |
51(79.7) |
0.946 |
117(28.9) |
25(21.4) |
92(78.6) |
0.661 |
|
|
Stage 4 (15 – 29) |
6(1.5) |
0(0.0) |
6(100.0) |
0.217 |
9(2.2) |
1(11.1) |
8(88.9) |
0.500 |
|
|
Stage 5 (<15) |
1(0.2) |
0(0.0) |
1(100.0) |
0.617 |
2(0.5) |
0(0.0) |
2(100.0) |
0.478 |
|
|
CKD (Stages 3 + 4 + 5) |
71(17.5) |
13(18.3) |
58(81.7) |
0.747 |
128(31.6) |
26(20.3) |
102(79.7) |
0.915 |
|
|
|
|
|
|
|
|
||||
|
CKD-EPI |
CKD-EPIomitting race factor |
||||||||
|
Stage 1 (>90) |
161(39.8) |
26(16.1) |
135(83.9) |
0.116 |
100(24.7) |
15(15.0) |
85(85.0) |
0.150 |
|
|
Stage 2 (60 – 89) |
165(40.7) |
41(24.8) |
124(75.2) |
0.043* |
177(43.7) |
40(22.6) |
137(77.4) |
0.249 |
|
|
Stage 3 (30 – 59) |
70(17.3) |
13(18.6) |
57(81.4) |
0.743 |
117(28.9) |
25(21.4) |
92(78.6) |
0.661 |
|
|
Stage 4 (15 – 29) |
8(2.0) |
1(12.5) |
7(87.5) |
0.592 |
9(2.2) |
1(11.1) |
8(88.8) |
0.500 |
|
|
Stage 5 (<15) |
1(0.2) |
0(0.0) |
1(100.0) |
0.617 |
2(0.5) |
0(0.0) |
2(100.0) |
0.478 |
|
|
CKD (Stages 3 + 4 + 5) |
79(19.5) |
14(17.7) |
65(82.3) |
0.573 |
128(31.6) |
26(20.3) |
102(79.7) |
0.915 |
|
After a univariate logistic regression analysis, this study observed that participants above age 69 years were about 2 to ten 10 times at risk of renal insufficiency compared to younger subjects, depending on the renal equation used. Using the 4v-MDRD and CKD-EPI equations, fasting plasma glucose levels above 22mmol/L was identified to increase the likelihood of renal insufficiency by 10-12 times. Microalbuminuria levels of 30 mg/day and above significantly increased the risk of renal insufficiency among the study participants by approximately 3-8 times (p<0.0001). Illiteracy (no education) also increased the risk of participants for renal insufficiency (Table 6).
Table 6. Univariate analysis of risk factors associated with renal insufficiency
|
CG |
4v-MDRD |
CKD-EPI |
||||
|
Variables |
cOR(95% CI) |
p value |
cOR(95% CI) |
p value |
cOR(95% CI) |
p value |
|
Age (30 – 49) |
||||||
|
50 – 69 |
1.6(0.8 – 3.2) |
0.172 |
0.9(0.4 – 1.8) |
0.698 |
1.1(0.5 – 2.2) |
0.821 |
|
70 – 89 |
10.1(4.6 - 22.2) |
< 0.0001* |
2.2(1.0 – 4.8) |
0.054 |
3.3(1.5 – 7.3) |
0.003* |
|
Duration (≤ 5) |
||||||
|
6 – 15 |
1.6(1.0 – 2.5) |
0.035 |
1.4(0.8 – 2.4) |
0.277 |
1.6(0.7 – 2.1) |
0.463 |
|
16 – 25 |
1.7(0.7 – 4.0) |
0.249 |
2.7(1.1 – 6.8) |
0.033 |
2.2(0.9 – 5.5) |
0.082 |
|
26 – 35 |
0.0(0.0 - i) |
1.000 |
2.9(0.3 - 32.7) |
0.393 |
2.4(0.2 – 26.8) |
0.484 |
|
Sex (male) |
||||||
|
Female |
0.9(0.5 - 1.5) |
0.665 |
1.1(0.6 – 2.2) |
0.695 |
1.2(0.6 – 2.3) |
0.573 |
|
FPG (<7) |
||||||
|
7 – 14 |
0.6(0.4 – 0.9) |
0.022 |
0.8(0.4 – 1.4) |
0.380 |
0.7(0.4 – 1.2) |
0.256 |
|
15 – 22 |
0.9(0.4 – 1.9) |
0.729 |
0.7(0.3 – 2.1) |
0.575 |
0.6(0.2 – 1.7) |
0.364 |
|
23 – 30 |
5.2(0.5 - 51.4) |
0.158 |
12.5(1.2 – 124.7) |
0.032 |
10.4(1.0 – 103.7) |
0.046 |
|
Microalbuminuria (< 30) |
||||||
|
30 – 300 |
3.1(2.0 – 4.8) |
< 0.0001* |
7.9(4.4 – 14.1) |
< 0.0001* |
6.1(3.6 - 10.4) |
< 0.0001* |
|
Alcohol (none) |
||||||
|
Moderate |
1.0(0.6 - 1.7) |
0.978 |
1.3(0.7 – 2.3) |
0.356 |
1.2(0.7–2.1) |
0.572 |
|
Chronic |
0.9(0.5 – 1.7) |
0.796 |
0.8(0.4 – 1.9) |
0.646 |
0.8(0.4–1.8) |
0.581 |
|
Education (basic) |
||||||
|
None |
2.3(1.4 – 3.6) |
0.001* |
1.6(0.9–2.7) |
0.108 |
1.3(0.7–2.1) |
0.391 |
|
Secondary |
0.8(0.3 – 1.9) |
0.611 |
0.9(0.3–2.6) |
0.901 |
0.7(0.3–2.0) |
0.529 |
|
Tertiary |
0.9(0.3 - 2.4) |
0.843 |
1.0(0.3 - 3.0) |
0.039* |
0.8(0.2–2.3) |
0.621 |
DISCUSSION
The average serum creatinine level of the participants was 90.1 ± 37.6µmol L-1, and 14.1% had abnormal creatinine levels (≥90/≥120 µmol L-1). A bias of 6.1 suggests that the 4v-MDRD equation would overestimate glomerular filtration rate compared to the CKD-EPI equation, while CG equation will underestimate GFR compared to the 4v-MDRD (bias of -9.6). Mean estimated GFR by the 4v-MDRD equation was significantly higher (89.0±35.0) than the estimations calculated using the CG (79.5 ± 38.6***) and CKD-EPI (83.0±26.6‡) equations. Prevalence of CKD in this study was 17.5%, 19.5%, and 26.7% for the 4v-MDRD, CKD-EPI, and CG equations respectively. The 4v-MDRD and CKD-EPI equations classified a higher percentage of the study population as suffering from CKD after omitting the race factor in the estimation (17.5% vs 31.6%; and 19.5% vs 31.6% respectively).
One of the earliest manifestations of renal dysfunction is the appearance of albumin in urine (microalbuminuria; >30 mg/day, but <300 mg/day) [27]. In a recent study in Pakistan, 25.6% of T2DM subjects had microalbuminuria [28]. This was relatively lower than the prevalence recorded in the current study (43.2%). The disparity could be explained by gender distribution differences between both studies [more males (60.9% males and 39.1% females) in their study vs more females (20.0% males and 80.0% females) in the current study]. However, our finding (43.2%) is consistent with a similar study that observed 44% prevalence of microalbuminuria among Sudanese type 2 diabetes subjects [29]. Abundant research has shown that diabetes and its complications play a significant role in the dysfunction of the glomerular basement membrane (GBM) filtration barrier; thus, albumin can be secreted into urine [30-32]. In the current study, the significant association between microalbuminuria and eGFR was found to be negative for all three eGFR equations and participants with microalbuminuria were approximately 8 times at risk for renal insufficiency, using the 4v-MDRD equation. This confirms that microalbuminuria is significantly associated with renal insufficiency [33].
Average serum creatinine was significantly higher among males than females. This observation agrees with a study by Bamanikar et al., (2016) which reported that average creatinine levels are likely to be higher in diabetic males than females due to higher muscle mass [34]. The serum creatinine of each participant was used to estimate GFR using each of the three eGFR equations. Using the Bland-Altman method of comparative analysis, we compared the performance of the various kidney function equations. We observed that the CG equation is likely to underestimate glomerular filtration compared to CKD-EPI (bias of -3.5). And with a bias of -9.6, the CG equation will also underestimate GFR compared to the 4v-MDRD. In a similar study in the Netherlands, the absolute bias of the CG equation was found to be due to the influence of body composition, particularly body mass and body mass index (BMI) [35]. This may be an explanation for the findings observed in the current study, with respect to the bias of the CG equation.
Significant differences in average GFR were observed among the various equations at some CKD stages. The total population mean GFR estimated with the CG and CKD-EPI equations were statistically comparable (79.5 ±38.6 and 83.0±26.6 respectively). Nevertheless, the 4v-MDRD equation projected significantly higher mean GFR (89.0±35.0) compared to the equations of CG (79.5 ± 38.6) and CKD-EPI (83.0±26.6). This trend was expected, as per the results obtained from the Bland-Altman analysis; that CG would underestimate GFR compared to the other two equations, while 4v-MDRD would overestimate GFR compared to the CKD-EPI equation. A similar trend was reported in a work conducted by Arora et al., (2012) where MDRD underestimated the prevalence of CKD (thus overestimated GFR) in blacks compared to the CKD-EPI formula [36].
Prevalence of CKD in this study was found to be 17.5%, 19.5%, and 26.7% for the 4v-MDRD, CKD-EPI, and CG equations respectively. A study on the impact of type 2 diabetes on impaired kidney function in Sub-Saharan African populations recorded a prevalence of 13.4% CKD using the 4v-MDRD equation [37], which was relatively lower than the results in the current study. The difference can be attributed to the different study populations (Ghana, Kenya, and Nigeria) used in their study compared to ours (from Ghana only). A study done in Ghana recorded a prevalence of 17% CKD among diabetic subjects in Cape Coast using the CKD-EPI equation [38], whilst we observed 19.5%. The relatively small difference could be attributed to the differences in site, gender, and age distributions. The CG equation quantified a significantly higher proportion of individuals as experiencing chronic renal insufficiency (lowest GFR and highest CKD prevalence) in comparison with the two other renal function equations. A systematic review of population-based studies in Nigeria revealed similar trends [39].
The prevalence of CKD estimated by the 4v-MDRD equation (17.5%) was similar (no statistically significant difference) to that of the CKD-EPI equation (19.5%). This is in line with a report published in the British Journal of General Practice in 2018, which stated that the MDRD and CKD-EPI equations classify similar proportions of subjects as having CKD even if GFR estimates are done in duplicate. In that study, Hirst and colleagues estimated GFR in duplicate for each eGFR equation (MDRD and CKD-EPI) and observed CKD for 64% of the respondents using the MDRD equation versus 63% with the CKD-EPI equation for a single screening test, and further observed 39% (MDRD equation) and 38% (CKD-EPI equation) when two positive tests (duplicate) were used [40].
However, Delanaye and colleagues in Belgium reported that the 4v-MDRD and CKD-EPI equations quantify significantly different prevalence of CKD. They observed that the prevalence of CKD by the MDRD equation was significantly and strongly higher than that of the CKD-EPI equation (11.04% vs. 7.98%; p=0.0012) despite the fact that both equations had good agreement [Kappa (k)= 0.82] and were highly correlated (r=0.93; p<0.0001) [41]. They explained that the significant differences in CKD prevalence could be due to the different applications of "age factor" in each equation [a constant exponent applied to age (age-0.20.3) in MDRD vs. age as an exponent in CKD-EPI (0.993age)]. Despite their explanation for their findings, the current study had comparable CKD prevalence between the MDRD and CKD-EPI equations. The inconsistency in findings between our study and theirs can be explained by; population differences [(Belgians (whites) vs. Ghanaians (blacks)] and CKD classification (stage 3 only, in their study vs. stages 3+4+5 in our study).
In comparison, the uncorrected CG equation (without BSA) categorized a higher number of the study population as suffering from CKD than the corrected CG equation with BSA (29.9% vs. 26.7%). The CG equation with BSA factor reduces bias (reduces the overestimation of GFR) and improves the accuracy of GFR estimation [42], hence the overestimation of CKD when BSA was omitted compared to the BSA inclusive CG equation in this study. The 4v-MDRD and CKD-EPI equations categorized a higher percentage of the study population as suffering from CKD when race factor was not accounted for (omitted) in the estimation (17.5% vs 31.6%; and 19.5% vs 31.6% respectively). In a retrospective longitudinal review among African Americans; it was observed that when MDRDwithout race was applied, 39.9% of subjects at CKD stages 1&2 using MDRDwith race were reclassified to stage 3a, 71.8% of subjects at stage G3a were reclassified to stage 3b, 54.1% of subjects were reclassified from stage 3b to stage 4 and 36.4% from stage 4 to stage 5. Moreover, when CKD-EPIwith race was compared with CKD-EPIwithout race, CKD reclassification was significant with 22.6%, 46.5%, and 38.3% of participants reclassified from stages 1&2, stage 3a, and stage 3b respectively [43]. These outcomes are in harmony with the findings in our study, where more participants were reclassified into CKD when the race factor was omitted from the MDRD and CKD-EPI equations. This phenomenon may imply that the “race-corrected factor” in the eGFR equations significantly overestimates GFR (thus reduces CKD classification), especially in black populations, and may result in missed opportunities for early detection, intervention, treatment referrals and kidney transplantation [44].
Gama et al., (2021), Bukabau et al., (2019), and Atta et al., (2021) assessed the CKD-EPI equation “with” and “without” the race factor and found improvements in accuracy when the race coefficient was removed [45-47]. Seape et al., (2016), Wyatt et al., (2013), and Holness et al., (2020) also evaluated the MDRD equation “with” and “without” the race factor and found improvements in accuracy when the race coefficient was removed [48-50]. Furthermore, in a recent systematic review on MDRD and CKD-EPI equations among Black adults, majority of the studies showed that omission of the race adjustment factor reduced bias and improved the accuracy and precision of the eGFR equations for Blacks [51]. This may be an explanation for the results obtained in this study; signifying that the race coefficient usage in assessing diagnostic biological methods is inherently flawed and lacks a resilient scientific premise and precision [52].
Studies have shown that age has significant effects on renal function and hence plays a major role in renal insufficiency [53]. Age in this study had a significant effect on the GFRs estimated by all three equations, where increasing age corresponded significantly to decreasing GFR. Moreover, participants with age ≥70 years were about 2-10 times at risk of CKD compared to those <70years. In a study in the Netherlands, Willems et al., (2013) reported similar findings. After age 70 years, the CG equation appeared to give moderately lower eGFRs (<60) in 90% of the subjects, followed by the CKD-EPI equation (68% of the subjects) and then the MDRD equation (55% of the subjects) [54]. This is in agreement with our study, as risk prediction for renal insufficiency (reduced eGFR/higher CKD prevalence) in respondents ≥70years was highest by the CG equation [OR=10.1(4.6 - 22.2); p<0.0001] followed by the CKD-EPI equation [OR=3.3(1.5 – 7.3); p=0.003] and the MDRD equation [OR=2.2(1.0 – 4.8); p=0.054]. Thus above age 70years in this Ghanaian setting (Black African population), GFR estimated by CKD-EPI equation underestimates renal function compared to GFR estimated by the MDRD equation, albeit not as much as the CG equation. Therefore, although studies carried out in relatively younger persons recommend that the CKD-EPI equation accurately classifies individuals [55,56], per our results and that of others [57-59], more research is warranted in older persons to validate the application of the eGFR equations in clinical practice for old age groups, especially in Africans (Blacks) to prevent needless diagnostic measures, therapeutic involvements and costs.
CONCLUSIONS
The CG equation underestimates GFR and overestimates CKD in diabetes subjects in Ghana compared to the 4v-MDRD and CKD-EPI equations. Classification of CKD is relatively the same using the CKD-EPI and MDRD equations. However, there is improved performance for both 4v-MDRD and CKD-EPI when race adjustment factor is omitted among the Ghanaian population (MDRDwithout race and CKD-EPIwithout race). Based on the findings in the study, the researchers conclude that the 4v-MDRD and CKD-EPI equations, without race adjustment factors, may be the best for African populations (Blacks). Further studies are warranted to validate and recommend the use of 4v-MDRDwithout race or CKD-EPIwithout race or both for renal function assessment among Ghanaian T2DM subjects. Race is an unsuitable representation for genetics worldwide, and struggles to disregard its use in GFR estimation ought to be global.
LIMITATIONS OF THE STUDY
The current study could not include healthy (non-diabetic) participants. We lacked the means to measure radioisotope GFR (mGFR) and use it as a reference to compare the eGFR equations. It is therefore recommended that these are considered in future studies to draw stronger conclusions across all health groups and age groups.
FUNDING
No funding was obtained for this study.
DISCLOSURE STATEMENT
No potential conflict of interest was reported by the authors.
REFERENCES
- Madala ND, Nkwanyana N, Dubula T, Naiker IP. (2012). Predictive performance of eGFR equations in South Africans of African and Indian ancestry compared with ⁹⁹mTc-DTPA imaging. Int Urol Nephrol. 44(3):847-855.
- Stevens LA, Levey AS. (2009). Measured GFR as a confirmatory test for estimated GFR. J Am Soc Nephrol. 20(11):2305-2313.
- Cockcroft DW, Gault MH. (1976). Prediction of creatinine clearance from serum creatinine. Nephron. 16(1):31-41.
- Park EJ, Wu K, Mi Z, Dong T, Lawrence JP, Ko CW, et al. (2012). A systematic comparison of cockcroft-gault and modification of diet in renal disease equations for classification of kidney dysfunction and dosage adjustment. Ann Pharmacother. 46(9):1174-1187.
- Nyman HA, Dowling TC, Hudson JQ, Peter WL, Joy MS, Nolin TD. (2011). Comparative evaluation of the Cockcroft-Gault Equation and the Modification of Diet in Renal Disease (MDRD) study equation for drug dosing: an opinion of the Nephrology Practice and Research Network of the American College of Clinical Pharmacy. Pharmacotherapy. 31(11):1130-1144.
- Levey AS, Bosch JP, Lewis JB, Greene T, Rogers N, Roth D. (1999). A more accurate method to estimate glomerular filtration rate from serum creatinine: a new prediction equation. Modification of Diet in Renal Disease Study Group. Ann Intern Med. 130(6):461-470.
- Flamant M, Haymann JP, Vidal-Petiot E, Letavernier E, Clerici C, Boffa JJ, et al. (2012). GFR estimation using the Cockcroft-Gault, MDRD study, and CKD-EPI equations in the elderly. Am J Kidney Dis. 60(5):847-849.
- Rigalleau V, Lasseur C, Perlemoine C, Barthe N, Raffaitin C, Liu C, et al. (2005). Estimation of glomerular filtration rate in diabetic subjects: Cockcroft formula or modification of Diet in Renal Disease study equation? Diabetes Care. 28(4):838-843.
- Froissart M, Rossert J, Jacquot C, Paillard M, Houillier P. (2005). Predictive performance of the modification of diet in renal disease and Cockcroft-Gault equations for estimating renal function. J Am Soc Nephrol. 16(3):763-773.
- Rule AD, Larson TS, Bergstralh EJ, Slezak JM, Jacobsen SJ, Cosio FG. (2004). Using serum creatinine to estimate glomerular filtration rate: accuracy in good health and in chronic kidney disease. Ann Intern Med. 141(12):929-937.
- Poggio ED, Wang X, Greene T, Van Lente F, Hall PM. (2005). Performance of the modification of diet in renal disease and Cockcroft-Gault equations in the estimation of GFR in health and in chronic kidney disease. J Am Soc Nephrol. 16(2):459-466.
- Levey AS, Stevens LA, Schmid CH, Zhang YL, Castro AF, CKD-EPI (Chronic Kidney Disease Epidemiology Collaboration). (2009). A new equation to estimate glomerular filtration rate. Ann Intern Med. 150(9):604-612.
- Murata K, Baumann NA, Saenger AK, Larson TS, Rule AD, Lieske JC. (2011). Relative performance of the MDRD and CKD-EPI equations for estimating glomerular filtration rate among patients with varied clinical presentations. Clin J Am Soc Nephrol. 6(8):1963-1972.
- Delanaye P, Pottel H, Botev R, Inker LA, Levey AS. (2013). Con: Should we abandon the use of the MDRD equation in favour of the CKD-EPI equation? Nephrol Dial Transplant. 28(6):1396-1403.
- Björk J, Jones I, Nyman U, Sjöström P. (2012). Validation of the Lund-Malmö, Chronic Kidney Disease Epidemiology (CKD-EPI) and Modification of Diet in Renal Disease (MDRD) equations to estimate glomerular filtration rate in a large Swedish clinical population. Scand J Urol Nephrol. 46(3):212-222.
- Buron F, Hadj-Aissa A, Dubourg L, Morelon E, Steghens JP, Ducher M, et al. (2011). Estimating glomerular filtration rate in kidney transplant recipients: performance over time of four creatinine-based formulas. Transplantation. 92(9):1005-1011.
- Levey AS, Tighiouart H, Titan SM, Inker LA. (2020). Estimation of Glomerular Filtration Rate With vs Without Including Patient Race. JAMA Intern Med. 180(5):793-795.
- Stevens LA, Claybon MA, Schmid CH, Chen J, Horio M, Imai E, et al. (2011). Evaluation of the Chronic Kidney Disease Epidemiology Collaboration equation for estimating the glomerular filtration rate in multiple ethnicities. Kidney Int. 79(5):555-562.
- Delanaye P, Mariat C, Maillard N, Krzesinski JM, Cavalier E. (2011). Are the creatinine-based equations accurate to estimate glomerular filtration rate in African American populations? Clin J Am Soc Nephrol. 6(4):906-912.
- van Deventer HE, Paiker JE, Katz IJ, George JA. (2011). A comparison of cystatin C- and creatinine-based prediction equations for the estimation of glomerular filtration rate in black South Africans. Nephrol Dial Transplant. 26(5):1553-1558.
- Maple-Brown LJ, Hughes JT, Lawton PD, Jones GR, Ellis AG, Drabsch K, et al. (2012). Accurate assessment of kidney function in indigenous Australians: the estimated GFR study. Am J Kidney Dis. 60(4):680-682.
- Delanaye P, Mariat C. (2013). The applicability of eGFR equations to different populations. Nat Rev Nephrol. 9(9):513-522.
- Botev R, Mallié JP, Wetzels JF, Couchoud C, Schück O. (2011). The clinician and estimation of glomerular filtration rate by creatinine-based formulas: current limitations and quo vadis. Clin J Am Soc Nephrol. 6(4):937-950.
- Du Bois D, Du Bois EF. (1989). A formula to estimate the approximate surface area if height and weight be known. 1916. Nutrition. 5(5):303-311.
- Levey AS, Coresh J, Greene T, Marsh J, Stevens LA, Kusek JW, Van Lente F; Chronic Kidney Disease Epidemiology Collaboration. (2007). Expressing the Modification of Diet in Renal Disease Study equation for estimating glomerular filtration rate with standardized serum creatinine values. Clin Chem. 53(4):766-772.
- Levey AS, Coresh J, Balk E, Kausz AT, Levin A, Steffes MW, Hogg RJ, Perrone RD, Lau J, Eknoyan G; National Kidney Foundation. (2003). National Kidney Foundation practice guidelines for chronic kidney disease: evaluation, classification, and stratification. Ann Intern Med. 139(2):137-147.
- Kaduka LU, Kombe Y, Kenya E, Kuria E, Bore JK, Bukania ZN, et al. (2012). Prevalence of metabolic syndrome among an urban population in Kenya. Diabetes Care. 35(4):887-893.
- Sana MA, Chaudhry M, Malik A, Iqbal N, Zakiuddin A, Abdullah M. (2020). Prevalence of Microalbuminuria in Type 2 Diabetes Mellitus. Cureus. 12(12):e12318.
- Rahamtalla F, Elagib AA, Mahdi A, Ahmed SM, et al. (2012). Prevalence of microalbuminuria among sudanese type 2 diabetic patients at elmusbah center at ombadda—omdurman. IOSR J Pharm. 2(5):51-55.
- Fici F, Bakir EA, Beyaz S, Makel W, Robles NR. (2018). PAIT-survey-Prevalence of albuminuria in patients with diabetes and hypertension in Turkey. Prim Care Diabetes. 12(6):558-564.
- Prasad RM, Tikaria R. Microalbuminuria. 2020.
- Matsuoka-Uchiyama N, Uchida HA, Okamoto S, Onishi Y, Katayama K, Tsuchida-Nishiwaki M, et al. (2022). The Association of Postprandial Triglyceride Variability with Renal Dysfunction and Microalbuminuria in Patients with Type 2 Diabetic Mellitus: A Retrospective and Observational Study. J Diabetes Res. 2022:3157841.
- Parving HH, Persson F, Rossing P. (2015). Microalbuminuria: a parameter that has changed diabetes care. Diabetes Res Clin Pract. 107(1):1-8.
- Bamanikar S, Bamanikar A, Arora A. (2016). Study of Serum urea and Creatinine in Diabetic and non-diabetic patients in in a tertiary teaching hospital. JMR. 2(1):12-15.
- Michels WM, Grootendorst DC, Verduijn M, Elliott EG, Dekker FW, Krediet RT. (2010). Performance of the Cockcroft-Gault, MDRD, and new CKD-EPI formulas in relation to GFR, age, and body size. Clin J Am Soc Nephrol. 5(6):1003-1009.
- Arora P, Rajagopalan S, Patel N, Nainani N, Venuto RC, Lohr JW. (2012). The MDRD equation underestimates the prevalence of CKD among blacks and overestimates the prevalence of CKD among whites compared to the CKD-EPI equation: a retrospective cohort study. BMC Nephrol. 13:4.
- Adebamowo SN, Adeyemo AA, Tekola-Ayele F, Doumatey AP, Bentley AR, Chen G, et al. (2016). Impact of Type 2 Diabetes on Impaired Kidney Function in Sub-Saharan African Populations. Front Endocrinol (Lausanne). 7:50.
- Ephraim RK, Arthur E, Owiredu WK, Adoba P, Agbodzakey H, Eghan BA. (2016). Chronic kidney disease stages among diabetes patients in the Cape Coast Metropolis. Saudi J Kidney Dis Transpl. 27(6):1231-1238.
- Chukwuonye II, Ogah OS, Anyabolu EN, Ohagwu KA, Nwabuko OC, Onwuchekwa U. (2018). Prevalence of chronic kidney disease in Nigeria: systematic review of population-based studies. Int J Nephrol Renovasc Dis. 11:165-172.
- Hirst JA, Montes MDV, Taylor CJ, Ordóñez-Mena JM, Ogburn E, Sharma V, et al. (2018). Impact of a single eGFR and eGFR-estimating equation on chronic kidney disease reclassification: a cohort study in primary care. Br J Gen Pract. 68(673):e524-e530.
- Delanaye P, Cavalier E, Mariat C, Maillard N, Krzesinski JM. (2010). MDRD or CKD-EPI study equations for estimating prevalence of stage 3 CKD in epidemiological studies: which difference? Is this difference relevant? BMC Nephrol. 11:8.
- Rostoker G, Andrivet P, Pham I, Griuncelli M, Adnot S. (2007). A modified Cockcroft-Gault formula taking into account the body surface area gives a more accurate estimation of the glomerular filtration rate. J Nephrol. 20(5):576-585.
- Yap E, Prysyazhnyuk Y, Ouyang J, Puri I, Boutin-Foster C, Salifu M. (2021). The Implication of Dropping Race from the MDRD Equation to Estimate GFR in an African American-Only Cohort. Int J Nephrol. 2021:1880499.
- Zelnick LR, Leca N, Young B, Bansal N. (2021). Association of the Estimated Glomerular Filtration Rate With vs Without a Coefficient for Race With Time to Eligibility for Kidney Transplant. JAMA Netw Open. 4(1):e2034004.
- Gama RM, Clery A, Griffiths K, Heraghty N, Peters AM, Palmer K, et al. (2021). Estimated glomerular filtration rate equations in people of self-reported black ethnicity in the United Kingdom: Inappropriate adjustment for ethnicity may lead to reduced access to care. PLoS One. 16(8):e0255869.
- Bukabau JB, Yayo E, Gnionsahé A, Monnet D, Pottel H, Cavalier E, et al. (2019). Performance of creatinine-or cystatin C-based equations to estimate glomerular filtration rate in sub-Saharan African populations. Kidney Int. 95(5):1181-1189.
- Atta MG, Zook K, Brown TT, Vaidya D, Tao X, Maier P, et al. (2021). Racial Adjustment Adversely Affects Glomerular Filtration Estimates in Black Americans Living with HIV. J Am Soc Nephrol. 32(9):2143-2147.
- Seape T, Gounden V, van Deventer HE, Candy GP, George JA. (2016). Cystatin C- and creatinine-based equations in the assessment of renal function in HIV-positive patients prior to commencing Highly Active Antiretroviral Therapy. Ann Clin Biochem. 53(Pt 1):58-66.
- Wyatt CM, Schwartz GJ, Owino Ong'or W, Abuya J, Abraham AG, Mboku C, et al. (2013). Estimating kidney function in HIV-infected adults in Kenya: comparison to a direct measure of glomerular filtration rate by iohexol clearance. PLoS One. 8(8):e69601.
- Holness JL, Bezuidenhout K, Davids MR, Warwick JM. (2020). Validation of equations to estimate glomerular filtration rate in South Africans of mixed ancestry. S Afr Med J. 110(3):229-234.
- Umeukeje EM, Koonce TY, Kusnoor SV, Ulasi II, Kostelanetz S, Williams AM, et al. (2022). Systematic review of international studies evaluating MDRD and CKD-EPI estimated glomerular filtration rate (eGFR) equations in Black adults. PLoS One. 17(10):e0276252.
- Grubbs V. (2020). Precision in GFR Reporting: Let's Stop Playing the Race Card. Clin J Am Soc Nephrol. 15(8):1201-1202.
- Delanaye P, Jager KJ, Bökenkamp A, Christensson A, Dubourg L, Eriksen BO, et al. (2019). CKD: A Call for an Age-Adapted Definition. J Am Soc Nephrol. 30(10):1785-1805.
- Willems JM, Vlasveld T, den Elzen WP, Westendorp RG, Rabelink TJ, de Craen AJ, et al. (2013). Performance of Cockcroft-Gault, MDRD, and CKD-EPI in estimating prevalence of renal function and predicting survival in the oldest old. BMC Geriatr. 13:113.
- Matsushita K, Tonelli M, Lloyd A, Levey AS, Coresh J, Hemmelgarn BR; Alberta Kidney Disease Network. (2012). Clinical risk implications of the CKD Epidemiology Collaboration (CKD-EPI) equation compared with the Modification of Diet in Renal Disease (MDRD) Study equation for estimated GFR. Am J Kidney Dis. 60(2):241-249.
- Matsushita K, Mahmoodi BK, Woodward M, Emberson JR, Jafar TH, Jee SH, Levey AS; Chronic Kidney Disease Prognosis Consortium. (2012). Comparison of risk prediction using the CKD-EPI equation and the MDRD study equation for estimated glomerular filtration rate. JAMA. 307(18):1941-1951.
- Madero M, Sarnak MJ. (2011). Creatinine-based formulae for estimating glomerular filtration rate: is it time to change to chronic kidney disease epidemiology collaboration equation? Curr Opin Nephrol Hypertens. 20(6):622-630.
- Chao CT, Tsai HB, Lin YF, Ko WJ, et al. (2014). Acute kidney injury in the elderly: only the tip of the iceberg. Journal of Clinical Gerontology and Geriatrics. 5(1):7-12.
- Chao CT, Wu VC, Lai CF, Shiao CC, Huang TM, Wu PC; NSARF group. (2012). Advanced age affects the outcome-predictive power of RIFLE classification in geriatric patients with acute kidney injury. Kidney Int. 82(8):920-927.