Information Links
Related Conferences
Previous Issues Volume 8, Issue 2 - 2023
Correlation of Pterygium Induced Severity of Dry Eye Disease with Total Surface area of Pterygium
Shreya Thatte*, Shlok O Singh and Garvesh Modi
Department of Ophthalmology, Sri Aurobindo Institute of Medical Science, Indore, Madhya Pradesh, India
*Corresponding Author: Shreya Thatte, Department of Ophthalmology, Sri Aurobindo Institute of Medical Science, Indore, Madhya Pradesh, India; Email: [email protected]
Received Date: September 4, 2023
Publication Date: October 19, 2023
Copyright: Thatte S, et al. © (2023)
ABSTRACT
Aim: To compare the pterygium induced severity of dry disease with total surface area of pterygium. Methods: Various grades of primary Pterygium cases underwent series of dry eye tests like Schirmer’s I and II, TBUT and Tear Meniscus Height. Total surface area of pterygium was measured and calculated manually. The patients were grouped according to their area measurement. The Chi Square was used to investigate the relationship among all variables with surface area of pterygium to find out association with dry eye. Results: Total seventy-five primary pterygium patients with various grades were included in this study. As per calculated surface area of pterygium, they were grouped in 3 categories. Calculated dry eye score showed mild dry eye disease in 25 -55 sq. mm surface area , patients with 55- 85 sq. mm observed moderate dry eye score and moderate to severe dry eye score was seen in > 85 sq. mm group. The association between surface area of pterygium and all variable of the respondents found to be significant (P ˂0.05). The present study verifies the fact that amount of pterygium induced dry eye is directly proportional to surface area of pterygium. Conclusion: Severity of pterygium induced dry eye disease is directly proportionate to surface area of Pterygium.
INTRODUCTION
Pterygium is an elastotic degeneration of bulbar conjunctiva, as it grows over the cornea causes tear film instability resulting in dry eye disease. Pterygium induced dry eye disease is very common in various types and grades of pterygium. It leads to changes in ocular surface resulting in symptoms of irritation, foreign body sensation and visual disparity [1,2]. Severity of pterygium induced dry eye depends on various factors like type of pterygium, grading of pterygium and damage to ocular surface leading to changes in goblet cell morphology. Co-relation of grading of pterygium and severity of dry eye is very well known [3,4]. It is directly proportionate to grading of pterygium, which increases with increase grade of pterygium [5-7]. Pterygium itself is responsible for changes in ocular surface [8,9]. In different grade and type of pterygium surface area of pterygium is also different. Whether larger surface area of pterygium leads to more ocular surface changes causing more severe dry eye disease, this factor is not known.
Therefore this study was conducted to initiate as a step towards evaluating the correlation between variable surface area of pterygium and severity of dry eye.
MATERIALS & METHODS
The present study was conducted after the approval of institutional ethical committee. Patients with all types and grades of pterygium willing to participate in the study were included after taking written informed consent.
The study data includes the complete demographic profile of patient. In addition to presenting complaints, past medical and surgical history was noted along with ocular examination to rule out adnexal, anterior and posterior segment diseases.
Patients were included fulfilled the following criteria: Inclusion Criteria: 1. Patients with primary pterygium with all grades and types. 2. Pterygium patients with any age
Exclusion criteria: 1. Patients not consenting for the study. 2 Patients with associated ocular surface comorbidities 3. Patients with systemic diseases\syndromes associated with dry eye 4. History of previous ocular surgery.
Pterygia were graded according to size and extent of corneal involvement, according to Sejalmaheshwari [4]
•Grade 1: At the limbus
•Grade 2: Between the limbus and a point midway between the limbus and pupillary margin
•Grade 3: Head of the pterygium reaching the pupillary margin
•Grade 4: Crossing the pupillary margin.
Presence of dry eyes was evaluated by Tear meniscus height (TMH), Tear film breakup time (TBUT), Schirmer’s 1 and 2. Inferior marginal tear TMH was recorded on slit lamp <0.25 mm suggested a dry eye condition. TBUT was noted to assess the status of precorneal tear film. A breakup time of <10 seconds was taken as abnormal. Schirmer’s test was performed using No. 41 Whatman filter paper, 5 mm wide and 35 mm long. The test was executed without topical anesthetic (Schirmer 1) and with topical anesthetic (Schirmer 2). A measurement of <10 mm in Schirmer 1 and <5 mm in Schirmer 2 indicated dry eye.
The surface area of Pterygium was measured manually in terms of triangular corneal part and trapezoid conjunctival part. Parameters recorded were corneal involvement (C), limbal length (L) and width of Pterygium at medial canthus (W). The maximum length (H} of Pterygium at temporal gaze is measured.
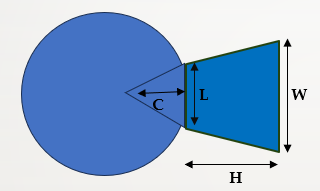
Surface Area = Area of triangle (corneal part) + Area of trapezium (conjunctival part)
= (1/2 base x Height) + {1/2 (sum of parallel side) *Height}
The data collected was qualitative in nature and Chi square test was used to calculate the association between these variables.
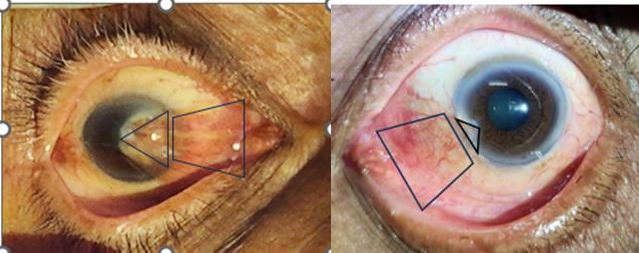
Figure 1: Grade 4 Nasal Pterygium. Figure 2: Grade 2 Nasal Pterygium.
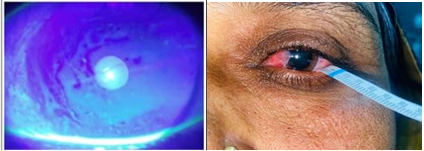
Figure 3: Schirmer’s 1 with Grade 2 Nasal Pterygium. Figure 4: TBUT with Grade 3 Nasal Pterygium.
Demographic data showed female preponderance especially higher percentages of females were seen in younger age group of less than 50 years.
Table 1: Distribution of Sex and Age Group in study patients.
|
Age Group |
SEX |
Total |
||
|
Female |
Male |
|||
|
< 50 Years |
Count |
18 |
9 |
27 |
|
% |
38.3% |
32.1% |
36.0% |
|
|
50-60 Years |
Count |
14 |
10 |
24 |
|
% |
29.8% |
35.7% |
32.0% |
|
|
60-70 Years |
Count |
15 |
9 |
24 |
|
% |
31.9% |
32.1% |
32.0% |
|
|
Total |
Count |
47 |
28 |
75 |
|
% |
100.0% |
100.0% |
100.0% |
|
Table 2: Association between surface area and pterygium grade.
|
Surface Area |
Pterygium Grade |
Total |
||
|
Grade 2 |
Grade 3 |
Grade 4 |
||
|
25-55 sq.mm. |
33 89.2% |
4 10.8% |
0 0.0% |
37 100% |
|
55-85 sq.mm. |
12 52.2% |
10 43.5% |
1 4.3% |
23 100% |
|
>85 sq.mm. |
5 33.3% |
7 46.7% |
3 20.0% |
15 100% |
|
Total |
50 66.7% |
21 28.0% |
4 5.3% |
75 100% |
Pearson chi-square test applied.
Chi-square value=21.844, df=4, P value=0.001, Significant
The above table shows the association between surface area and pterygium grade. 37 patients were having surface area between 25-55 sq.mm. Of them, 33 (89.2%) patients had pterygium grade 2, and 4 (10.8%) patients had pterygium grade 3.
23 patients were having surface area between 55-85 sq.mm. Of them, 12 (52.2%) patients had pterygium grade 2, 10 (43.5%) patients had pterygium grade 3 and 1 (4.3%) patient had pterygium grade 4. 15 patients were having surface area >85 sq.mm. Of them, 5 (33.3%) patients had pterygium grade 2, 7 (46.7%) patients had pterygium grade 3 and 3 (20%) patients had pterygium grade 4.
There was a statistically significant association between surface area and the pterygium grade (P=0.001). The pterygium grade is dependent on the surface area. With the increase in the surface area, there is an increase in the pterygium grade of the patients.
Table 3: Association between Surface area and Schirmer 1.
|
Surface Area |
Schirmer1 |
Total |
||
|
<10 |
20-Oct |
>20 |
||
|
25-55 sq.mm. |
0 |
5 |
32 |
37 |
|
0.00% |
13.50% |
86.50% |
100% |
|
|
55-85 sq.mm. |
0 |
11 |
12 |
23 |
|
0.00% |
47.80% |
52.20% |
100% |
|
|
>85 sq.mm. |
1 |
9 |
5 |
15 |
|
6.70% |
60.00% |
33.30% |
100% |
|
|
Total |
1 |
25 |
49 |
75 |
|
1.30% |
33.30% |
65.30% |
100% |
|
Pearson chi-square test applied.
Chi-square value=18.504, df=4, P value=0.001, Significant
The above table shows the association between surface area and schirmer 1.
37 patients were having surface area between 25-55 sq.mm. Of them, 5 (13.5%) patients had schirmer 1 10-20, and 32(86.5%) patients had schirmer 1 >20.
23 patients were having surface area between 55-85 sq.mm. Of them, 11 (47.8%) patients had schirmer 1 10-20, and 12(52.2%) patients had schirmer 1 >20.
15 patients were having surface area >85 sq.mm. Of them, 1 (6.7%) patient had schirmer 1 <10, 9 (60%) patients had schirmer 1 10-20, and 5 (33.3%) patients had schirmer 1 >20
There was a statistically significant association between surface area and the schirmer 1 (P=0.001). With the increase in surface area, there is a decrease in the schirmer 1.
Table 4: Association between Surface area and Schirmer 2.
|
Surface Area |
Schirmer 2 |
Total |
||
|
<10 |
20-Oct |
>20 |
||
|
25-55 sq.mm. |
0 |
18 |
19 |
37 |
|
0.00% |
48.60% |
51.40% |
100% |
|
|
55-85 sq.mm. |
0 |
20 |
3 |
23 |
|
0.00% |
87.00% |
13.00% |
100% |
|
|
>85 sq.mm. |
1 |
9 |
5 |
15 |
|
6.70% |
60.00% |
33.30% |
100% |
|
|
Total |
1 |
47 |
27 |
75 |
|
1.30% |
62.70% |
36.00% |
100% |
|
Pearson chi-square test applied.
Chi-square value=13.161, d f=4, P value=0.011, Significant.
The above table shows the association between Surface area and schirmer 2.
37 patients were having surface area between 25-55 sq.mm. Of them, 18 (48.6%) patients had schirmer 2 10-20, and 19 (51.4%) patients had schirmer 2 >20.
23 patients were having surface area between 55-85 sq.mm. Of them, 20 (87%) patients had schirmer 2 10-20, and 3, (13%) patients had schirmer 2 >20.
15 patients were having surface area >85 sq.mm. Of them, 1 (6.7%) patient had schirmer 2 <10, 9 (60%) patients had schirmer 2 10-20, and 5 (33.3%) patients had schirmer 2 >20.
There was a statistically significant association between surface area and the schirmer 2 (P=0.011). Most of the patients with surface area between 25-55 sq.mm. had schirmer 2 >20, while patients with surface area between 55-85 sq.mm. and >85 sq.mm had schirmer 2 10-20.
Table 5: Association between surface area and TUBT grade.
|
Surface Area |
TUBT grade |
Total |
||
|
<10 |
10-20 |
>20 |
||
|
25-55 sq.mm. |
0 0.0% |
10 27.0% |
27 73.0% |
37 100% |
|
55-85 sq.mm. |
0 0.0% |
15 65.2% |
8 34.8% |
23 100% |
|
>85 sq.mm. |
2 13.3% |
6 40.0% |
7 46.7% |
15 100% |
|
Total |
2 2.7% |
31 41.3% |
42 56.0% |
75 100% |
Pearson chi-square test applied.
Chi-square value=16.999, df =4, P value=0.002, Significant
The above table shows the association between surface area and TUBT grade.
37 patients were having surface area between 25-55 sq.mm. Of them, 10 (27%) patients had TUBT grade 10-20, and 27(73%) patients had TUBT grade >20.
23 patients were having surface area between 55-85 sq.mm. Of them, 15 (65.2%) patients had TUBT grade 10-20, and 8(34.8%) patients had TUBT grade >20.
15 patients were having surface sarea >85 sq.mm. Of them, 2 (13.3%) patients had TUBT grade <10, 6 (40%) patients had TUBT grade 10-20, and 7 (46.7%) patients had TUBT grade >20.
There was a statistically significant association between surface area and the TUBT grade (P=0.002). With the increase in surface area, there is a decrease in the TUBT grade.
Table 6: Association between surface area and tear meniscus height.
|
Surface Area |
Tear meniscus height |
Total |
||
|
<0.22 |
0.22 |
>0.22 |
||
|
25-55 sq.mm. |
17 45.9% |
11 29.7% |
9 24.3% |
37 100% |
|
55-85 sq.mm. |
14 60.9% |
8 34.8% |
1 4.3% |
23 100% |
|
>85 sq.mm. |
5 33.3% |
7 46.7% |
3 20.0% |
15 100% |
|
Total |
36 48.0% |
26 34.7% |
13 17.3% |
75 100% |
Pearson chi-square test applied.
Chi-square value=5.724, df=4, P value=0.221, Not Significant
The above table shows the association between surface area and tear meniscus height.
37 patients were having surface area between 25-55 sq.mm. Of them, 17 (45.9%) patients had tear meniscus height of <0.22, 11 (29.7%) patients had tear meniscus height of 0.22, and 9 (24.3%) patients had tear meniscus height of >0.22.
23 patients were having surface area between 55-85 sq.mm. Of them, 14 (60.9%) patients had tear meniscus height of <0.22, 8 (34.8%) patients had tear meniscus height of 0.22, and 1 (4.3%) patient had tear meniscus height of >0.22.
15 patients were having surface area >85 sq.mm. Of them, 5 (33.3%) patients had tear meniscus height of <0.22, 7 (46.7%) patients had tear meniscus height of 0.22, and 3 (20%) patients had tear meniscus height of >0.22.
There was no statistically significant association between surface area and the tear meniscus height (P=0.221). The tear meniscus height is not dependent on the surface area.
DISCUSSION
This study showed female preponderance in pterygium patients in the age group of 28–70 years similar to Antony, et al. [1] unlike the study done by Li, et al [6] where age group ranged between 39- 69 years. In our study most of the patients were farmers, working in the field exposing to sunlight and dust, which has direct relation in development of pterygium [3]. Ocular surface changes leading to dry eye and its association with pterygium is well known [10,11] which is directly proportionate with grade of pterygium. Increasing grade of pterygium shows increase in dry eye.
There are many studies comparing grade of pterygium with dry eye disease [11,12] but not co- relating with surface area of pterygium. It is well known that pterygium causes changes in ocular surface. In our previous study [13] we found that goblet cell number significantly reduced in the nasal part of the conjunctiva, over pterygium tissue. So there is possibility of larger surface area of pterygium leading to more severe of dry eye. Therefore we thought of calculating total surface area of pterygium to observe the correlation with dry eye disease severity.
Schirmer’s test I and II showed very significant results (P value=0.001, Significant) in the form of severity of dry eye in direct correlation with surface area of pterygium, similar like what other studies [12] observed with increasing grade of pterygium severity of dry eye increases with decrease schirmer’s values. Anthony, et al. [1] and Kampitak and Leelawongtawun [10] recorded schirmer’s value and co-related it with size of pterygium on the cornea, measuring length from limbus to tip of pterygium. They found no relation of schirmer’s test value with size of pterygium.
On co-relating the TBUT and surface area of pterygium, it was found to be statistically significant (P <0.05). TBUT was decreasing with increase in surface area of pterygium, indicating severity of dry eye disease increases with increase in surface area. This finding is consistent with El-Sersy TH [11] and Rajiv et al. [12] who in their study found that pterygium cases had significantly reduced TBUT values, but they compare it with grading not with surface area of pterygium. In dry eye test TMH was another variable. In our study, we found no co-relation with surface area of pterygium. It was not significant (P value=0.221, Not Significant). Maistone JC, et al. [14] recorded Tear Meniscus Height and co -relate with dry eye disease. They found that tear meniscus height reduced in dry eye disease cases.
Total surface area of pterygium has definite effect on ocular surface changes leading to dry eye disease. Larger pterygium as such Primes more cosmetic blemish with more dry eye. So to obtain an enhanced cosmetic excellence, extended removal of pterygium with conjunctival limbal autograph can significantly reduce dry eye symptoms. There was definite increase in severity of dry eye disease showed by decreasing values of TBUT and Schirmer’s I and II with increasing surface area of pterygium, which is similar like effect of grade of pterygium on induced dry eye disease.
CONCLUSION
This study found that the TBUT and Schirmer’s Test was decreased significantly in the eye with pterygium. The surface area of pterygium showed a positive correlation with Tear Break up Time and Schirmer’s Test results, indicating that increase in surface area of pterygium increases severity of dry eye there was no significant association found between surface area and the tear meniscus height. Thus, the results of the present study strongly suggest that pterygium induces abnormal ocular surface conditions, which lead to dysfunctional tear film and development of the dry eye. The severity of dry eye is directly proportionate to the surface area of pterygium.
REFERENCES
- Antony AT, Mini PA, Dalia S. (2017). Pterygium and dry eye-a clinical correlation. J Med Scie Clin Res. 5:23654-23659.
- Li M, Zhang M, Lin Y, Xiao Q, Zhu X, Song S, et al. (2007). Tear function and goblet cell density after pterygium excision. Eye. 21(2):224–228.
- Sihota R, Tandon R. (2011). Diseases of the conjunctiva. In: Parson’s diseases of the eye. (21st) Sihota R, Tandon R. India; Elsevier. 181.
- Maheshwari S. (2007). Pterygium-induced corneal refractive changes. Ind J Ophthalmol. 55(5):383.
- Ye F, Zhou F, Xia Y, Zhu X, Wu Y, Huang Z. (2017). Evaluation of meibomian gland and tear film changes in patients with pterygium. In J Ophthalmol. 65(3):233.
- Li N, Deng XG, He MF. (2012). Comparison of the Schirmer I test with and without topical anesthesia for diagnosing dry eye. Int J Ophthalmol. 5(4):478.
- Özcura F, Aydin S, Helvaci MR. (2007). Ocular surface disease index for the diagnosis of dry eye syndrome. Ocul Immunol Inflamm. 15(5):389-393.
- Li N, Wang T, Wang R, Duan X. (2019). Tear Film Instability and Meibomian Gland Dysfunction.Correlate with the Pterygium Size and Thickness Pre- and Postexcision in Patients with Pterygium. J Ophthalmol. 2019:5935239.
- Bandyopadhyay R, Nag D, Mondal SK, Gangopadhyay S, Bagchi K, Bhaduri G. (2010). Ocular surface disorder in pterygium: Role of conjunctival impression cytology. Indian J Pathol Microbiol. 53:692-695:
- Kampitak K, Leelawongtawun W. (2014). Precorneal tear film in pterygium eye. J Med Assoc Thai. 97:536-539.
- El Sersy TH. (2014). Role of pterygium in ocular dryness. J Egypt Ophthalmol Soc. 107:205-208
- Rajiv, Mithal S, Sood AK. (1991). Pterygium and dry eye –A clinical correlation. Indian J Ophthalmol. 39:15-6.
- Shreya Thatte, Shlok O Singh, Dhruv Agrawal, Garvesh Modi (2022) Correlation of the Different Grades of Pterygium with Severity of Dry Eye Disease. J Ophthalmol Res Rev Rep. 4(1): 1-5.
- Mainstone JC, Bruce AS, Golding TR. (1996). Tear meniscus measurement in the diagnosis of dry eye. Curr Eye Res. 15(6):653–661.