Information Links
Related Conferences
Current Issue Volume 11, Issue 1 - 2026
AST/ALT Ratio: Differential Diagnostic Modality Between ALD and Viral Hepatitis – A Preliminary Study
Sangeetha Sahoo1, Muni Kumar D2, Hari Priya S2,*
1NexIVD Laboratories Pvt Ltd, Hyderabad, Telangana, India
2Department of Biochemistry, School of Allied & Healthcare Sciences, Malla Reddy University, Hyderabad, Telangana, India
*Corresponding Author: Hari Priya S, Department of Biochemistry, School of Allied & Healthcare Sciences, Malla Reddy University, Hyderabad, Telangana, India, Email: [email protected]
Received Date: February 25, 2026
Published Date: March 13, 2026
Citation: Sahoo S, et al. (2026). AST/ALT Ratio: Differential Diagnostic Modality Between ALD and Viral Hepatitis – A Preliminary Study. Mathews J Gastroenterol Hepatol. 11(1):40.
Copyrights: Sahoo S, et al. © (2026).
ABSTRACT
Liver disease, major global health burden and accurate differentiation between viral and alcoholic hepatitis is crucial for prognostic assessment, yet the systematic evaluation of cost-effective biochemical markers in populations remains limited. This observational cross-sectional analytical study was conducted at a tertiary care hospital, Hyderabad, India; including 150 participants equally distributed among three groups (n = 50 each). Biochemical parameters were analyzed using fully automated Beckman Coulter AU5800 and platelet count by electrical impedance principle. Independent t-test and one-way ANOVA were performed; p-value < 0.05 was considered statistically significant. The biochemical findings revealed early progression of liver disease, characterized by elevated levels of total and direct bilirubin and significantly elevated ALT. In contrast alcoholic hepatitis showed higher AST compared to viral hepatitis group and slightly increased globulin with lower A/G ratio. Platelet count was significantly decreased in viral hepatitis indicating increased risk of hepatic coagulopathy. This study highlights those simple, cost-effective markers, including AST/ALT ratio, bilirubin levels, and platelet count, may serve as non-invasive indicators of liver injury and aid in differentiating Alcoholic from Viral hepatitis.
Keywords: Non- Invasive, Biomarker, Liver Disease, AST/ALT Ratio, Therapeutic Approach.
INTRODUCTION
Multi-functional organ, Liver involved in synthesis of proteins and digestive enzymes and plays a central role in detoxification [1]. Viral hepatitis caused by Hepatitis B Virus (HBV) and Hepatitis C Virus (HCV) is a major global health burden, affecting 325 million people worldwide reported by World Health Organization (WHO) [2]. Alcohol has emerged as a major cause of liver dysfunction, affecting youth and middle-aged people in rapidly urban regions [3].
Liver function tests (LFTs) provide valuable insights in diagnosis and treatment of liver diseases. Correlation of morphologic changes with functional changes improves interpretive ability of LFTs, implying that in most cases of diffuse parenchymal changes, LFTs are abnormal, while in cases of focal changes, regardless of severity, only a few parameters are affected. Varied etiologies of liver disease, viz., viral, toxic, biliary, and purulent, have distinct clinical, laboratory, and morphologic features, similarly, different types of cirrhosis have distinct biochemical characteristics, and their detection and management have been significantly enhanced via LFTs [4,5].
Therefore, precise differentiation between liver disease etiologies based only on clinical evaluation can be challenging [6]. Individual history may be unreliable due to social stigma associated with alcohol consumption. This diagnostic uncertainty can delay appropriate treatment and affect clinical outcomes [7].
LFTs are crucial in evaluating pathophysiology of liver and in determining pathogenesis, being a cost-effective procedure for diagnosis. While LFTs may not distinguish during inflammation of liver, they can differentiate significant fibrosis, which is crucial for monitoring individuals who is prone to developing complications from hepatic cirrhosis. Serum ALT is considered first marker to be used to assess liver disease because of its high sensitivity and specificity [8,9].
Biochemical markers profiling offers a reliable approach for differential diagnosis of liver disease. The pattern of aminotransferase elevation, particularly the AST/ALT ratio, has demonstrated diagnostic utility in distinguishing alcohol-related liver injury from other etiologies [10].Viral hepatitis typically presents with alanine aminotransferase predominance, reflecting primary hepatocellular damage, while alcoholic liver injury characteristically shows aspartate aminotransferase predominance due to mitochondrial injury and nutritional deficiencies associated with chronic alcohol consumption [11,12].
Recent advances in non-invasive hepatic assessment have reinforced the clinical value of traditional biochemical markers. Studies have found that serum markers incorporating AST/ALT ratios remain useful as preliminary assessments for assessing chronic liver disease [13]. Furthermore, emerging evidence suggests that specific biochemical patterns can provide valuable diagnostic and prognostic information in acute hepatitis presentations [14].
Despite possible utility of biochemical profiling, systematic evaluation of LFTs to differentiate viral from alcoholic hepatitis in Indian populations remains limited. Prior investigations have mainly focused on Western cohorts. Population specific biochemical patterns and provide optimal cut off values require an investigation to address important gap in current knowledge [15,16].
This study aims to compare and correlate different markers of hepatic biochemical profile ALT, AST, ALP, bilirubin, total protein, platelet count and uric acid using correlation coefficients and p values. This study was designed to explain the complexities and clinical implications of liver diseases, therefore, emphasizing need for proper diagnosis and management. The study is aimed to evaluate the diagnostic presentation of these biochemical parameters in distinguishing of viral hepatitis from alcoholic hepatitis and prove evidence-based diagnostic criteria which can be interpreted in a diverse clinical setting.
MATERIAL & METHODS
Study Design and Setting
We conducted an observational cross-sectional analytical study at Malla Reddy Hospital, Hyderabad, India. The study protocol was approved by the Institutional Ethics Committee of Malla Reddy Institute of Medical Sciences, Hyderabad, Telangana (Ref No: MRIMS/DHR-IEC-MSC-BIO/2025/26).
Study Population
Inclusion Criteria
Individuals between 18 - 60 years of age with confirmed diagnosis based on appropriate clinical, biochemical, and serological diagnostic parameters.
A total of 150 participants were recruited and equally distributed among three groups (n=50 each):
· Group 1 (Viral Hepatitis): Individuals aged between 18 - 60 years diagnosed with acute & chronic viral hepatitis with positive serology tests for hepatitis B & C, with clinical manifestations and biochemical indicators.
· Group 2 (Alcoholic Hepatitis): Individuals aged 18 - 60 years with clinical and biochemical evidence of alcoholic liver disease, with a known history of chronic alcohol use.
· Group 3 (Controls): Normal controls (matched for age and gender), healthy controls having normal liver function tests with no history of liver disease, alcohol abuse, or viral hepatitis.
All participants provided written informed consent after a detailed explanation of study objectives and procedures.
Exclusion Criteria
Exclusion criteria included hepatocellular carcinoma, drug-induced hepatitis, autoimmune liver disease, MASLD, pregnancy, concurrent systemic illness, cardiac disease or use of hepatotoxic medications. Individuals with known chronic conditions that may affect liver function markers were also excluded from the study.
Specimen collection
Venous blood samples collected from clinically and diagnostically confirmed individuals with Alcoholic hepatitis and Viral hepatitis (HBV and HCV). Approximately 5 ml of blood was drawn aseptically from the antecubital vein under standard conditions. Out of this, 3 mL was transferred into a serum separator tube for biochemical analysis, and 2 mL was collected in an EDTA tube for haematological assessment.
Serum was separated from clotted blood by centrifugation at 4000 rpm for 10 minutes and stored at −20°C until further analysis. Separated serum was used for the estimation of total, direct, and indirect bilirubin, aspartate transaminase (AST), alanine transaminase (ALT), alkaline phosphatase (ALP), total protein, albumin, globulin, albumin-to-globulin (A/G) ratio, and uric acid, while platelet count was determined using standard haematological methods.
Laboratory Analysis
Biochemical parameters were analyzed using Beckman Coulter AU5800, a fully automated analyzer; IFCC kinetic UV method was used to measure AST, ALT, and ALP, serum bilirubin was measured using modified diazo method, albumin by bromocresol green method, Serum uric acid was estimated using enzymatic uricase–peroxidase (POD) method, and platelet count was measured using electrical impedance principle on an automated 3-part hematology analyzer. The following calculated and measured Biochemical Parameters were evaluated, total, direct, and indirect bilirubin, ALT, AST, ALP, total protein, albumin, globulin, albumin-to-globulin (A/G) ratio, platelet count, and serum uric acid.
Statistical Analysis
The statistical analysis was carried out by using SPSS version 29.0 (IBM Corporation, NY, USA). The mean and standard deviation was assessed and T test was performed between the groups and the parametric data were analyzed using one-way analysis of variance (ANOVA). The percentage of individuals with abnormal values was calculated using established reference ranges. Statistical significance was defined as p < 0.05.
RESULTS
In the present study, controls had normal liver function parameters; total bilirubin 0.30 ± 0.02 mg/dL, ALT 22.78 ± 9.12 IU/L, AST 23.34 ± 8.95 IU/L, ALP 82.15 ± 24.07 IU/L, total protein 6.9 ± 0.6 g/dL, albumin 4.15 ± 0.37 g/dL, globulin 2.8 ± 0.52 g/dL, A/G ratio 1.54 ± 0.35, platelet count 2.6 ± 0.2 ×10⁵/µL, and uric acid 4.8 ± 0.9 mg/dL.
Viral hepatitis showed marked elevations in total bilirubin (6.21 ± 2.15 mg/dL), direct bilirubin (2.77 ± 2.38 mg/dL), indirect bilirubin (3.50 ± 2.10 mg/dL), ALT (387.14 ± 289.52 IU/L), AST (228.72 ± 260.46 IU/L), and ALP (198.15 ± 109.37 IU/L), along with decreased albumin (3.15 ± 0.52 g/dL), A/G ratio (1.12 ± 0.26), and platelet count (1.1 ± 0.1 ×10⁵/µL).
In alcoholic hepatitis, ALT levels (142.94 ± 36.48 IU/L) were lower than AST levels (AST 264.66 ± 108.12 IU/L), as the differences in AST levels between the two etiologies are not significant, ALT levels were higher in viral hepatitis, resulting in a significantly increased AST/ALT ratio in alcoholic hepatitis (1.85 ± 0.34), which is characteristic of alcohol-induced liver injury. ALP was elevated in both groups, but were more pronounced in viral hepatitis 198.15 ± 109.37 IU/L) compared with alcoholic hepatitis (150.15 ± 29.37 IU/L). Both hepatitis groups had decreased total protein and albumin, increased globulin concentrations, thrombocytopenia, and elevated uric acid levels (viral: 8.7 ± 1.0 mg/dL; alcoholic: 10.8 ± 1.2 mg/dL) compared to controls.
The comparative analysis of liver function parameters revealed distinct biochemical patterns among control, viral hepatitis, and alcoholic hepatitis groups (Table 1,2 & 3). Control group showed normal liver function. In viral hepatitis, marked elevations in bilirubin levels and ALT/AST levels, indicating significant hepatocellular injury, ALP levels were elevated, suggesting cholestasis (Table 4). Alcoholic hepatitis group showed an elevation of AST over ALT, indicated by a high AST/ALT ratio, consistent with alcohol-related liver damage (Figure 1). Both hepatitis groups showed reduced total protein and albumin levels with increased globulin (Figure 2), decreased albumin-to-globulin (A/G) ratio (Figure 3), indicating impaired liver function. Thrombocytopenia was observed in both disease groups, more severe in viral hepatitis. Uric acid levels were higher in alcoholic hepatitis (Figure 4). Overall, viral hepatitis was characterized by more severe transaminase and bilirubin elevation (Figure 5), whereas alcoholic hepatitis showed a distinctive AST predominance and higher uric acid levels, clearly differentiating the biochemical profiles of the three groups.
Table 1. Descriptive Statistics of Biochemical Parameters by Disease Group
|
Parameter with Reference Ranges |
Control (n=50) MEAN ± SD |
Viral Hepatitis (n=50) |
Alcoholic Hepatitis (n=50) |
|
Total Bilirubin (0.1-0.2 mg/dL) |
0.30 ± 0.02 |
6.21 ± 2.15 |
4.85 ± 2.12 |
|
Direct Bilirubin (0-0.3mg/dL) |
0.20 ± 0.10 |
2.77 ± 2.38 |
1.89 ± 1.29 |
|
Indirect Bilirubin (0.2-0.8 mg/dL) |
0.30 ± 0.1 |
3.50 ± 2.10 |
3.10 ± 1.80 |
|
ALT (≤ 40 IU/L) |
22.78 ± 9.12 |
387.14 ± 289.52 |
142.94 ± 36.48 |
|
AST (≤ 40 IU/L) |
23.34 ± 8.95 |
228.72 ± 260.46 |
264.66 ± 108.12 |
|
ALP (44-147 IU/L) |
82.15 ± 24.07 |
198.15 ± 109.37 |
150.15 ± 29.37 |
|
Total protein (6-7 g/dL) |
6.9 ± 0.6 |
6.2 ± 0.8 |
6.2 ± 0.7 |
|
Albumin (3.5-5.0 g/dL) |
4.15 ± 0.37 |
3.15 ± 0.52 |
3.17 ± 0.37 |
|
Globulin (2.0-3.5 g/dL) |
2.8 ± 0.52 |
3.10 ± 0.60 |
3.40 ± 0.8 |
|
A/G Ratio (1.1-2.5) |
1.54 ± 0.35 |
1.12 ± 0.26 |
1.02 ± 0.18 |
|
AST/ALT Ratio |
1.02 ± 0.15 |
0.54 ± 0.12 |
1.85 ± 0.34 |
|
Platelet count (1.5- 4.5 X 10⁵/µL) |
2.6 ± 0.2 |
1.1 ± 0.1 |
0.9 ± 0.1 |
|
Uric acid (3.0–7.0 mg/dL) |
4.8 ± 0.9 |
8.7 ± 1.0 |
10.8 ± 1.2 |
Table 2. Comparison of Biochemical Parameters Between Control and Viral Hepatitis Group
|
Parameter |
Control (n=50) (Mean ± SD) |
Viral Hepatitis (n=50) (Mean ± SD) |
p- value |
|
Total Bilirubin (mg/dL) |
0.30 ± 0.02 |
6.21 ± 2.15 |
0.001 |
|
Direct Bilirubin (mg/dL) |
0.20 ± 0.10 |
2.77 ± 2.38 |
0.05 |
|
Indirect Bilirubin (mg/dL) |
0.30 ± 0.1 |
3.50 ± 2.10 |
0.05 |
|
ALT / SGPT (U/L) |
22.78 ± 9.12 |
387.14 ± 289.52 |
0.001 |
|
AST / SGOT (U/L) |
23.34 ± 8.95 |
228.72 ± 260.46 |
0.001 |
|
ALP (U/L) |
82.15 ± 24.07 |
198.15 ± 109.37 |
0.06 |
|
Total Protein (g/dL) |
6.9 ± 0.6 |
6.2 ± 0.8 |
0.9 |
|
Albumin (g/dL) |
4.15 ± 0.37 |
3.15 ± 0.52 |
0.04 |
|
Globulin (g/dL) |
2.8 ± 0.52 |
3.10 ± 0.60 |
0.03 |
|
A/G Ratio |
1.54 ± 0.35 |
1.12 ± 0.26 |
0.001 |
|
Platelet Count (×10⁵/µL) |
1.02 ± 0.15 |
0.54 ± 0.12 |
0.06 |
|
Uric Acid (mg/dL) |
2.6 ± 0.2 |
1.1 ± 0.1 |
0.001 |
Table 3. Comparison of Biochemical Parameters Between Control and Alcoholic Hepatitis Group
|
Parameter |
Control (n=50) (Mean ± SD) |
Alcoholic Hepatitis (n=50) (Mean ± SD) |
p- value |
|
Total Bilirubin (mg/dL) |
0.30 ± 0.02 |
4.85 ± 2.12 |
0.001 |
|
Direct Bilirubin (mg/dL) |
0.20 ± 0.10 |
1.89 ± 1.29 |
0.05 |
|
Indirect Bilirubin (mg/dL) |
0.30 ± 0.1 |
3.10 ± 1.80 |
0.01 |
|
ALT / SGPT (U/L) |
22.78 ± 9.12 |
142.94 ± 36.48 |
0.001 |
|
AST / SGOT (U/L) |
23.34 ± 8.95 |
264.66 ± 108.12 |
0.001 |
|
ALP (U/L) |
82.15 ± 24.07 |
150.15 ± 29.37 |
0.6 |
|
Total Protein (g/dL) |
6.9 ± 0.6 |
6.2 ± 0.7 |
0.9 |
|
Albumin (g/dL) |
4.15 ± 0.37 |
3.17 ± 0.37 |
0.05 |
|
Globulin (g/dL) |
2.8 ± 0.52 |
3.40 ± 0.8 |
0.04 |
|
A/G Ratio |
1.54 ± 0.35 |
1.02 ± 0.18 |
0.01 |
|
Platelet Count (×10⁵/µL) |
1.02 ± 0.15 |
1.85 ± 0.34 |
0.01 |
|
Uric Acid (mg/dL) |
2.6 ± 0.2 |
0.9 ± 0.1 |
0.03 |
Table 4. Comparison of Biochemical Parameters Between viral and Alcoholic Hepatitis Group
|
Parameter |
Viral Hepatitis (n=50) (Mean ± SD) |
Alcoholic Hepatitis (n=50) (Mean ± SD) |
p- value |
|
Total Bilirubin (mg/dL) |
6.21 ± 2.15 |
4.85 ± 2.12 |
0.05 |
|
Direct Bilirubin (mg/dL) |
2.77 ± 2.38 |
1.89 ± 1.29 |
0.04 |
|
Indirect Bilirubin (mg/dL) |
3.50 ± 2.10 |
3.10 ± 1.80 |
0.6 |
|
ALT / SGPT (U/L) |
387.14 ± 289.52 |
142.94 ± 36.48 |
0.05 |
|
AST / SGOT (U/L) |
228.72 ± 260.46 |
264.66 ± 108.12 |
0.07 |
|
ALP (U/L) |
198.15 ± 109.37 |
150.15 ± 29.37 |
0.03 |
|
Total Protein (g/dL) |
6.2 ± 0.8 |
6.2 ± 0.7 |
1 |
|
Albumin (g/dL) |
3.15 ± 0.52 |
3.17 ± 0.37 |
0.9 |
|
Globulin (g/dL) |
3.10 ± 0.60 |
3.40 ± 0.8 |
0.04 |
|
A/G Ratio |
1.12 ± 0.26 |
1.02 ± 0.18 |
0.07 |
|
Platelet Count (×10⁵/µL) |
0.54 ± 0.12 |
1.85 ± 0.34 |
0.05 |
|
Uric Acid (mg/dL) |
1.1 ± 0.1 |
0.9 ± 0.1 |
0.03 |
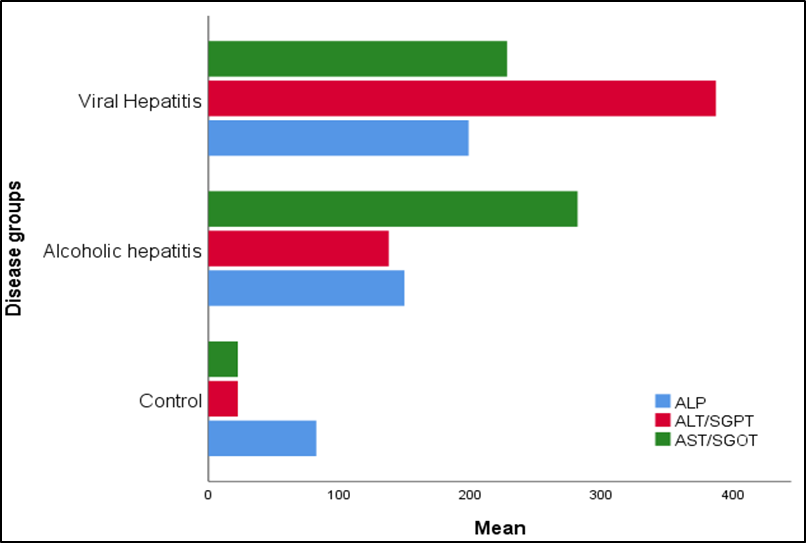
Figure 1. Comparative Distribution of serum enzyme markers in Control, Viral Hepatitis, and Alcoholic Hepatitis Groups.
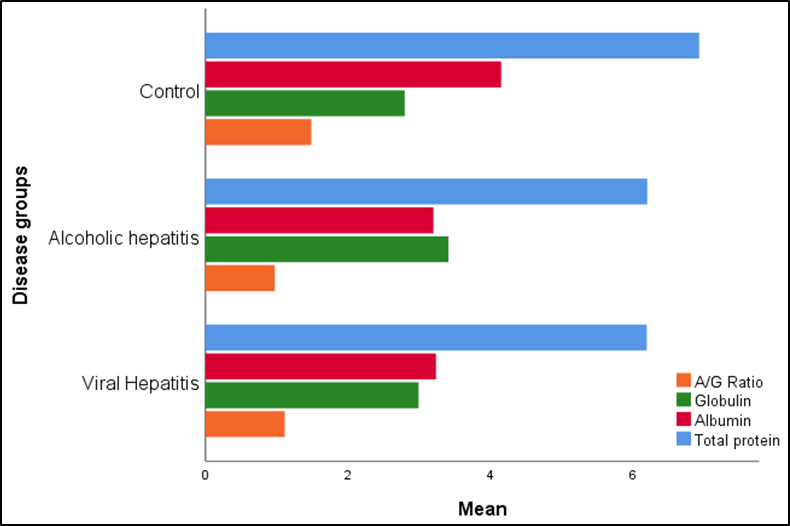
Figure 2. Comparative Distribution of Serum Protein Parameters in Control, Viral Hepatitis, and Alcoholic Hepatitis Groups.

Figure 3. Comparative Distribution of A/G ratio in Control, Alcoholic Hepatitis, and Viral Hepatitis Groups.
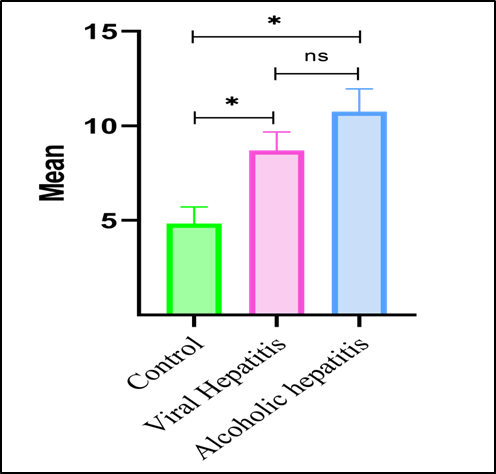
URIC ACID
Figure 4. Comparative Distribution of Serum Uric Acid Levels in Control, Alcoholic Hepatitis, and Viral Hepatitis Groups.
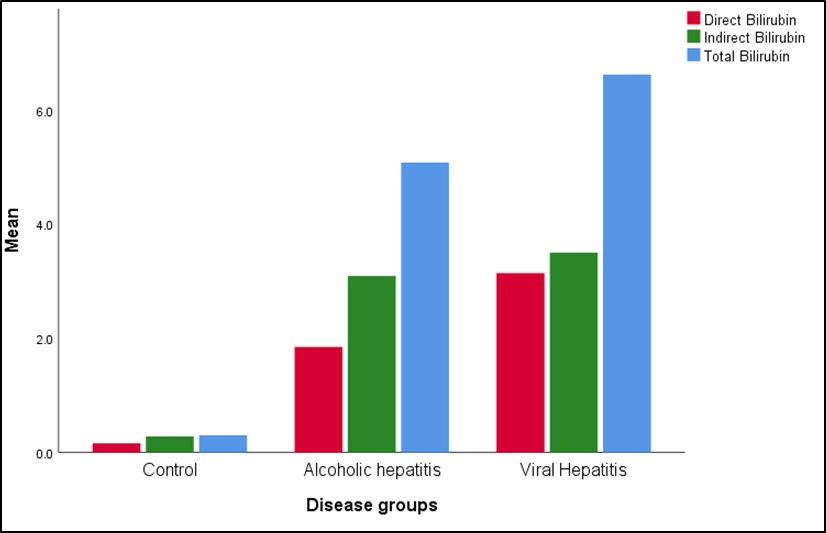
Figure 5. Comparative Distribution of Serum Bilirubin Fractions (Total, Direct, and Indirect) in Control, Alcoholic Hepatitis, and Viral Hepatitis Groups.
DISCUSSION
Our present study provides clinically related insights to distinguish viral and alcoholic hepatitis using routine LFTs. Distinct biochemical patterns include, elevated AST/ALT levels in alcoholic hepatitis and alteration in bilirubin and protein parameters, highlights significant diagnostic and prognostic relevance in hepatic disorders. Based in an Indian tertiary care setting, these findings provide population-specific evidence that could support early and cost-effective clinical decision-making.
Moreover, evaluation of serum albumin and A/G ratio highlights the efficacy of synthetic function markers in evaluating severity of disease. This study indicates that utilizing validated, easily accessible laboratory tests enhances the stratification of individuals, promotes early clinical intervention and targets management strategies when treating hepatitis in resource limited settings.
According to on-going hepatic research, changes in specific liver enzymes and metabolites might indicate hepatocellular damage and functional impairment. ALT/AST ratio emerged as a clinically useful parameter for distinguishing between alcoholic and viral hepatitis. Viral hepatitis showed ALT dominance with a lower AST/ALT ratio whereas, alcoholic hepatitis was characterized by a higher AST/ALT ratio, corresponding to AST predominance as well as platelet count were decreased in disease progression. The observed differential enzymatic pattern may be the result of distinct hepatocellular damage and enzymatic secretion mechanisms between viral and Alcoholic hepatitis [17]. Our findings are consistent with earlier studies showing that an AST/ALT ratio > 2.0 is associated with alcoholic liver disease. 70% of individuals with alcoholic hepatitis in this study met these criteria, supporting diagnostic relevance of ratio in the studied cohort. Sheth et al. reported that higher AST/ALT ratios are associated with severity of liver disease [18].
The observed AST predominance in alcoholic hepatitis is linked to increased mitochondrial and cytosol AST release and reduced ALT activity due to vitamin B6 deficiency associated with chronic alcohol consumption. Oxidative damage to mtDNA and respiratory chain complexes, decreased ATP synthesis, and altered mitochondrial dynamics are all indicators of ethanol-induced mitochondrial dysfunction, that enhances hepatocyte damage and stimulates the release of AST. These mitochondrial and enzymatic alterations, could be beneficial in distinguishing viral and alcoholic hepatitis. Findings of this study indicates the presence of biochemical patterns in viral and alcoholic hepatitis in individuals, highlighting the importance of liver function monitoring for etiological differentiation [19,20].
Contemporary multicentre studies suggested that diagnostic utility of AST/ALT ratio may be consistent across different healthcare settings. In a prospective cohort study Liu et al. showed that AST/ALT ratio maintained independent prognostic value across multiple centres, these findings indicate that AST/ALT ratio may provide clinically useful information across different populations [21]; however, further studies need to be conducted to evaluate diagnostic value of the AST/ALT ratio. This pattern may reflect intrahepatic cholestasis with hepatocellular injury and should be validated in a large cohort sample [22]. variations in bilirubin metabolism provides additional diagnostic values.
Severe hypoalbuminemia was observed in 86-88% of individuals in both disease groups and may be indicative of hepatic dysfunction. Similar albumin levels in both viral and alcoholic hepatitis might be related to severity of acute disorders and protein synthesis irrespective of etiology. Studies shown reduction of albumin/globulin (A/G) ratio from controls to viral hepatitis and alcoholic hepatitis may potentially be associated with varying inflammatory activity and altered immunoglobulin profiles [23]. Albumin has prognostic value that goes beyond diagnosis, affecting clinical therapy and outcome prediction in individuals with hepatic dysfunction. In the current study both diseased groups individuals showed severe hypoalbuminemia (< 3.0 g/dL), indicating significant hepatic impairment and emphasizing the necessity of careful monitoring and intensive supportive care. Hypoalbuminemia has been found in several studies to be a reliable prognostic marker in a variety of clinical settings. Its significance as a universal predictive biomarker in hospitalized individuals with hepatic and other systemic illnesses was highlighted by Oster et al., who showed that low blood albumin levels are independently associated with higher morbidity and death, irrespective of cause of the disease [24].
Furthermore, Takahashi et.al. reported that albumin concentrations are significantly linked with reduced long-term survival in individuals with chronic liver disease and hence confirming albumin's central role as a predictive biomarker for poor hepatic outcomes [25]. Together, these observations align with our results suggesting that severe hypoalbuminemia represents severe hepatic dysfunction indicating a worse clinical outcome, helping in risk assessment and supportive therapeutic interventions. Our results are especially relevant in resource-limited settings considering that biochemical markers assessed are cost effective, non-invasive and easily accessible. Recent investigations have reported similar biochemical profiles in a variety of different populations, which has validated usefulness of such simple serum indices as AST/ALT ratio in preliminary evaluation of severity of a liver disease when advanced imaging modalities are not available [26]. Our study spreads this evidence to previous research by showing that the findings are not only statistically significant but also clinically relevant.
The large effect sizes observed (η² > 0.50 in most parameters) represent differences that are substantial enough to conclude on evidence-based diagnostic decision making. These results support a hierarchical approach of diagnosis that starts with assessment of AST/ALT ratios and support these findings with evaluation of ALT concentrations and bilirubin patterns. However, our study has limitations, observational cross-sectional analytical study, inherently, limits ability to evaluate changes overtime, although simple size was sufficient for statistical analysis, it may restrict generalization of findings to the general patient cohort. Future research, that address these limitations would further confirm the usefulness of these biochemical markers in diverse clinical settings.
CONCLUSION
Our preliminary study provides strong evidence of systematic biochemical profiling in differential diagnosis of viral and alcoholic hepatitis in individuals. The AST/ALT ratio is a major differentiating marker between chronic disease groups of 2 etiologies. Complementary changes in level of ALT concentration and bilirubin metabolism provide improves accuracy of diagnosis. These evidence-based criteria using easily available and cost-effective tests, can be implemented in different healthcare settings. The large effect sizes and statistical reliability are implicated in clinical relevance of these biochemical patterns to improve precision of diagnoses and decision making during therapeutic process. Potential use of these in healthcare settings with a large proportion of individuals infected with hepatitis requires prospective research that will focus on longitudinal validation, integration into biomarker and into clinical guidelines to optimise hepatitis diagnosis and management.
ETHICS STATEMENT
This study was conducted with approval from the Institutional Ethics Committee Ref No: MRIMS/DHR-IEC-MSC-BIO/2025/26), Malla Reddy Institute of Medical Sciences, Hyderabad, Telangana. All participants provided written informed consent after detailed explanation of study procedures.
AUTHOR CONTRIBUTIONS
Conceptualization: [SS]; Methodology: [SS & HP]; Data Collection: [SS, HP]; Statistical Analysis: [SS, Mk & HP]; Writing - Original Draft: [SS]; Writing - Review & Editing: [SS, MK & HP]; Supervision: [HP]. All authors read and approved the final manuscript.
CONFLICT OF INTEREST
The authors declare no conflict of interest.
FUNDING
This research received no grant funding from any agency in public, commercial, or not-for-profit sectors.
ACKNOWLEDGEMENT
Authors would like to thank Dr Prabhudas, Scientist, NexIVD Laboratories Pvt Ltd, Hyderabad, India for them in-time support.
REFERENCES
- Gala KS, Vatsalya V. (2020). Emerging non-invasive biomarkers, and medical management strategies for alcoholic hepatitis: present understanding and scope. Cells. 9(3):524.
- Sharma HD, Singh A, Prasad N, Gupta A. (2020). Clinical-biochemical profile and etiology of acute viral hepatitis in hospitalized young adults at tertiary care center. J Family Med Prim Care. 9(2):947-952.
- Arora U, Singh B, Aggarwal P. (2020). Study of viral markers, clinical and biochemical profile of viral hepatitis in individuals of alcoholic liver disease. Int J Adv Med. 7(4): 612-618.
- Shashidhar KN, Nallagangula KS. (2019). Pros and cons of existing biomarkers for cirrhosis of liver. Acta Sci Med Sci. 3(6):63-72.
- Nallagangula KS, Nagaraj SK, Venkataswamy L, Chandrappa M. (2017). Liver fibrosis: a compilation on the biomarkers status and their significance during disease progression. Future Sci OA. 3(1):FSO124.
- Liu H, Li H, Deng G, Zheng X, Huang Y, Chen J, et al. (2024). Association of AST/ALT ratio with 90-day outcomes in individuals with acute exacerbation of chronic liver disease: a prospective multicentre cohort study in China. Front Med. 11:1307901.
- Shah ND, Ventura-Cots M, Abraldes JG. (2022). Biomarkers and prognostic indicators in alcoholic hepatitis. J Hepatol. 76(2):424-435.
- Liangpunsakul S, Haber P, McCaughan GW. (2016). Alcoholic liver disease in Asia, Europe, and North America. Gastroenterology. 150(8):1786-1797.
- Giannini EG, Testa R, Savarino V. (2005). Liver enzyme alteration: a guide for clinicians. CMAJ. 172(3):367-379.
- Im GY. (2023). Emerging biomarkers in alcohol-associated hepatitis. J Clin Exp Hepatol. 13(1).
- Cash WJ, O'Neill S, O'Donnell ME, McCance DR, Young IS, McEneny J, et al. (2012). What is the real function of the liver 'function' tests? Ulster Med J. 81(1):30-36.
- Taiwo M, Huang E, Pathak V, Bellar A, Welch N, Dasarathy J, et al. (2024). Non-invasive biomarkers for differentiating alcohol associated hepatitis from acute decompensation in individuals with ALD. J Clin Med. 13(13):3747.
- Kwo PY, Cohen SM, Lim JK. (2017). ACG clinical guideline: evaluation of abnormal liver chemistries. Am J Gastroenterol. 112(1):18-35.
- Bao S, Zheng J, Li N, Huang C, Chen M, Cheng Q, et al. (2024). Non-invasive assessment of liver fibrosis in hepatitis B individuals. Diagnostics. 14(4):389.
- Shah ND, Ventura-Cots M, Abraldes JG. (2022). Biomarkers and prognostic indicators in alcoholic hepatitis. J Hepatol. 76(2):424-435.
- Swaroop S, Vaishnav M, Arora U, Biswas S, Aggarwal A, Sarkar S, et al. (2024). Etiological spectrum of cirrhosis in India: a systematic review and meta-analysis. J Clin Exp Hepatol. 14(2):101291.
- Xuan Y, Wu D, Zhang Q, Yu Z, Yu J, Zhou D. (2024). Elevated ALT/AST ratio as a marker for NAFLD risk and severity: insights from a cross-sectional analysis in the United States. Front Endocrinol. 15:1457598.
- Sheth SG, Flamm SL, Gordon FD, Chopra S. (1998). AST/ALT ratio predicts cirrhosis in individuals with chronic hepatitis C virus infection. Am J Gastroenterol. 93(1):44-48.
- Negi AS, Chowdary AR. (2003). Biochemical evaluation of individuals of alcoholic liver disease and non-alcoholic liver disease. Indian J Clin Biochem. 18(2):27-34.
- Arumugam MK, Gopal T, Kalari Kandy RR, et al. (2023). Mitochondrial Dysfunction‑Associated Mechanisms in the Development of Chronic Liver Diseases. Biology (Basel). 12(10):1311.
- Liu H, Li H, Deng G, Zheng X, Huang Y, Chen J, et al. (2024). Association of AST/ALT ratio with 90-day outcomes in individuals with acute exacerbation of chronic liver disease. Front Med. 11:1307901.
- Kaur D, Prabhakar K, Das S. (2022). Distribution of HCV genotypes and HCV RNA viral load in hepatitis infected individuals. Bioinformation. 18(4):387-391.
- Hossain MS, Alam MR, Hasan MI, Sharif JU, Kabir MA, Islam MA, et al. (2019). Prevalence of serological markers of viruses in individuals of acute hepatitis. Mymensingh Med J. 28(2):278-285.
- Oster HS, Dolev Y, Kehat O, Weis-Meilik A, Mittelman M. (2022). Serum hypoalbuminemia is a long-term prognostic marker in medical hospitalized patients, irrespective of the underlying disease. J Clin Med. 11(5):1207.
- Takahashi H, Kawanaka M, Fujii H, Iwaki M, Hayashi H, Toyoda H, et al. (2023). Association of serum albumin levels and long-term prognosis in patients with biopsy-confirmed non-alcoholic fatty liver disease. Nutrients. 15(9):2014.
- WHO. (2024). Global hepatitis report 2024: action for access in low- and middle-income countries. Geneva: World Health Organization.