Information Links
Related Conferences
Previous Issues Volume 6, Issue 1 - 2023
Assessment of Undernutrition and Its Influencing Factors among Prisoners Living with HIV/AIDS in North Shoa Zone Amhara Region Ethiopia, 2022
Yohannis Yilma*, Metasebia Getachew, Asrat Fenta, Yordanos Mezemir
Debre Berhan Health Science College, Ethiopia
*Corresponding Author: Yohannis Yilma, Debre Berhan Health Science College, Ethiopia; Email: [email protected]
Received Date: April 30, 2023
Publication Date: May 20, 2023
Citation: Yilma Y, et al. (2023). Assessment of Undernutrition and Its Influencing Factors among Prisoners Living with HIV/AIDS in North Shoa Zone Amhara Region Ethiopia, 2022. Mathews J HIV AIDS. 6(1):23.
Copyrights: Yilma Y, et al. © (2023)
ABSTRACT
Background: Nutrition status is one of the health problems in developing countries. Prisons typically comprise marginalized sections of society and at high nutritional risk due to lack of diet diversity; And there is a lack of clarity on the dimensions of food security this study was identifying malnutrition and associated factors among prisoners to alleviate the problem. Objective: This study aimed to assess the nutritional status and influencing factors among prisoners in North Shoa prison, Ethiopia in 2021. Method: Institution based comparative cross-sectional study was conducted from August 01 to September 10; 2021. Multi-stage sampling technique was employed to recruit a total of 364 study participants. Data has been collected by using interviewer administered questionnaire. Weight and height measured and BMI was calculated as weight/height (kg/m2). Haemoglobin measurement has been measured by a simple procedure for determining iron level in blood using Hemo-cue methods. Cleaned data was entered to Epi data version 3.1 and transferred to SPSS version 25 for further analysis, Bivariate and multivariate logistic regression was fitted to identify factors associated with under nutrition (nutritional status). Significance variable was obtained with adjusted odds ratio at 95% CI of p< 0.05. Result: The overall prevalence of under nutrition among prisoners estimated as 33.8% (95% CI 28.8-39.3); and the prevalence of anaemia among PLHIV and negative sero-status residents was 54.2%, 50.8% respectively. The respondents who had anaemia were 3.26 times more likely to develop malnutrition AOR 3.269[95 % CI 1.908-5.600]) than who had no anaemia. had anaemia (AOR 4.464 [95 % CI 1.556-12.81]), hadn’t social support (AOR 6.281 [95 % CI 2.153-18.321]), age group 30 to 39 (AOR 0.180 [95 % CI 0.038-0.844]), use alcohol before jail (AOR 3.048 [95 % CI 1.037-8.965]).Conclusion: The prevalence of malnutrition among prisoners in north Shoa zone was high and haemoglobin (anaemia) was found as an important risk factor associated with malnutrition.
Keywords: Nutrition status, Prison, Dietary intakes
Abbreviations: AIDS: Acquired Immuno Deficiency syndrome; AOR: Adjust Odd Ratio; BMI : Body Mass Index; CI: Confidence Interval; COR: Crud Odd Ratio; DC: Data collector; EAR: estimated average requirements; EDTA: Ethylene Diamine tetra acetic acid; Hgb: Haemoglobin; HIV: Human Immuno deficiency Virus; ICPR: Institute for Criminal Policy Research; OIs: Opportunity Infections; OR: Odds Ratio; OSS-3: Oslo‐3 Social Support Scale; PCV: Packed cell volume; PI: Principal Investigator; PLHIV: People Living with Human Immuno deficiency Virus; PPS: Probability proportional to population size; QoL: Quality of Life; RNA: Ribo Nucleic Acid; RPM: Revolution per minute; SPSS: Statistical Package for Social Sciences; UDHR: universal declaration of human right; WHO: World Health Organization; WPB World:Prison Brief
INTRODUCTION Background There are over 10.2 million persons held in prisons and detention centres worldwide [1]. Prisons typically comprise marginalized sections of society and at high nutritional risk due to lack of diet diversity. As these prisoners depend on few kinds of food for a long time and in a situation, adequacy of nutritional requirement is a great issue of concern [2]. A prison is an institution where diverse people who have run afoul of the law live. On the other hand, prisoners are people who are being held in an institution such as prison or jail; they have no control over their environment as a result of their incarceration. Prison is not just a mechanism for inflicting punishment on the prisoner, but also a centre of rehabilitation [3]. A major factor influencing nutritional status is decreased consumption of foods with adequate concentrations of nutrients. Many factors play a role in determining dietary intake. Socioeconomic, psychological, ethnic, physiological, and pathological factors all influence dietary intake, interacting in a complex and intertwining manner. For example, financial stress can lead to depression, which in turn adversely affects dietary intake. Inadequate intake can lead to protein-calorie malnutrition, which in itself can cause anorexia, depression, and apathy, ultimately setting up a vicious cycle [4]. Poor nutrition increases the body’s vulnerability to infections, and infections aggravate poor nutrition. Inadequate dietary intake leads to poor nutrition and lowers immune system functioning. Poor nutrition reduces the body’s ability to fight infections and therefore helps increase the incidence, severity, and length of infections. Symptoms that accompany infections such as loss of appetite, diarrhoea, and fever lead to reduced food intake, poor nutrient absorption, nutrient loss, and altered metabolism. All of these contribute to weight loss and growth faltering, which further weaken the immune system. An adequate nutrient-dense diet, proper hygiene, food safety, and nutrition management of symptoms are critical interventions to break the cycle of infection and poor nutrition [5]. Some studies reported that poor nutrition is significantly associated with severity of pneumococcal pneumonia and risk of acquiring tuberculosis infection [6,7]. Other studies showed that underweight and micronutrient deficiencies were associated with higher odds of respiratory infections [8]. Anaemia is a major public health problem in Ethiopia. According to the most recent estimates of the World Health Organization (WHO) anaemia currently affects 2 billion people throughout the world. Although the immediate causes of anaemia among prisoner are known (including malnutrition and infections), the importance of contextual determinants and their relationships with individual effects have rarely been explored [9]. In general, in Africa, there is limited evidence on the various health problems of prisoners despite the relevance of such evidence on the health of the prisoners, their inmates, and the general community [10]. In the case of Ethiopia, the prison health system seems to be not well integrated with the national health system and health problems of prisoners are mostly marginalized by researchers [11]. According to the 2015 report by World Prison Brief (WPB) and Institute for Criminal Policy Research (ICPR), in Ethiopia, the total prison population has grown by 66.9% since 2000, reaching 104,467 in 2010/2011 [12]. Statement of the problem Nutritional status is one of the health problems in developing countries, and its occurrence is aggravated by poor hygienic condition and little access to health problem [13]. Nutrition and its epidemiologic transition have its own impact on changes in diet and activity patterns, leading to the development of a double burden of malnutrition. Changes in nutritional intake combined with increasingly sedentary life styles and failing to meet nutritional needs may lead to decreased immunity and increased susceptibility to infections, which can lead to further malnutrition [14]. Nutritional status includes environmental, economic, biological, educational, and cultural factors, as well as issues pertaining to food security. Nutritional status directly affects the prisoner in items of physical and mental health development. The main medical conditions for which prisoners are treated include diarrhoea and dysentery (42%), fever, including typhoid fever (25%) skin disease (20%), malnutrition (8%), psychological problems (1.5%) and heart problems (1%). The high frequency of diarrhea and skin disease is due to poor sanitation conditions prevailing inside prisons. The living conditions of prisoners in jails are unhygienic. This is due to overcrowding of the prisons with the large numbers of under trials [15]. Prisoners being a potentially vulnerable group, little information on intakes and food practices are available. Diets need to be supportive of health and well-being, as well as meet financial obligations of the state (e.g. getting value for money) [16]. In low-income countries including Ethiopia, undernutrition is common in prisons. More than half of the detainees are seriously undernourished [17]. According to universal declaration of human right (UDHR), one of the basic human right that prisoners, article 25(1), must have access to adequate and healthy food choice to meet their nutritional needs. Additionally, Mandela rule ‘22’ state that every prisoner shall be provide by the prison administration at the usual hours with food of nutritional value adequate for health and strength, of whole some and quality and well prepared and served. Drinking water shall be available to every prisoner whenever she/he needs [18]. In Ethiopia, the total prison population has grown by 66.9% since 2000 reaching 104,467 in 2010/2011 [12]. There is great gap in the prevalence of malnutrition among prison inmates in Guinea (5%) and in north Tigryi region prison (25.2%) thus this study is needed to identify the factors of the gap between this two study areas on under nutrition In particular, there is a lack of clarity on the dimensions of food security critical for improving health related quality of life for Prisoners. There is great gap in the prevalence of malnutrition among prison inmates in Guinea (5%) and in north Tigryi region prison (25.2%) thus this study is needed to identify the factors of the gap between this two study areas on under nutrition. There are limited studies on the adequacy of prisoner diet and food practices, yet understanding these are important to inform food provision and assure duty of care for this group. The aim of this study is to assess the dietary intakes of prisoners to inform food and nutrition policy and attempt to assess the nutritional status of prisoners living in selected prisons in North Shoa Zone Amhara Region Ethiopia SIGNIFICANCE OF THE STUDY The study will be expected to be useful in the following areas. First, the study will contribute a better understanding of the overall nutritional status of prisons and associated factors. Secondly, it give some guide line information to policy makers, prison administration and other stakeholders who seek to improve prison’s nutritional status in the study area. The study is also important in putting baseline information to the next work as springboard for researchers who would like to conduct detailed and comprehensive study either in North Shoa or another study area. Results of this study will be useful in advising the policy makers and in planning nutrition support and intervention programmes for prisoners in Ethiopia. Objective General objective
- To assess under nutrition and its influencing factors among prisoners living with HIV/AIDS in North Shoa Zon Amhara Region Ethiopia 2021.
Specific objectives
- To determine under nutrition of prisoners in North Shoa Zon Amhara Region Ethiopia 2021.
- To identify factors affecting under nutrition of prisoners in North Shoa Zon Amhara Region Ethiopia 2021.
METHODS AND MATERIAL Study area and period The study was conducted in five prisons found in North Shoa zone, Amhara region, Ethiopia. North Shoa located in Amhara National Regional State of Ethiopia. The selection was based on geographical location. It accommodates thousands of inmates every year and was one of the major prisons in Federal level and regional level. It had 5180 prison inmates at time of data collection. The function of North Shoa Prisons used to accommodate prisoners who are serving long-term sentences, life imprisonment or those who had condemned and remands with difficult cases such as armed robbery, murder cases or raping. The prisons were divided into male and female zones, comprising sentenced prisoners currently, and 5180 of which males 4760 and 420 females. Debre Brehan prison comprises around 1750 sentenced prisoners currently, of which 1450 males and 300 females, Alemketema prison accommodates 380 to 450 inmates per day, Mehalmeda prison which accommodates male and female inmates also prison accommodates 440 to 460 inmates daily, Ataye Prison accommodates 390 to 440 inmates per day and Shoarobit prison are only male comprising around 2990 sentenced prisoners currently. The prisons have five primary school and health facility with a total of 15 health professional (7 clinical nurses, 3 pharmacy technicians, 4 laboratory technician and 1 environmental health professional). The study was conducted from August 01 to September 10, 2021[19-33]. Study design Comparative cross Sectional study design was conducted from August 01 to September 10, 2021. Population Source population It comprises all prisoners living with HIV/AIDS found in north shoa zone. The prisons were Debreb Brehan, Alemketema, Mehalmeda, Ataye and Shoarobit. Study population The study population was all prisoners living with HIV/AIDS, North Shoa Ethiopia. Who were willing to participate in the study, during the study period and meet the inclusion criteria? Study units Randomly selected prisoners in the selected prisons. Eligibility Criteria Inclusion criteria
- Stayed in the prison for at least six months
- Adult: aged 18 years or above
- Able to understand the interview
Exclusion criteria
- Prisoners who are severely ill and physically impaired people with severe intellectual disability or dementia
Sample size determination The sample size for this study was estimated by two methods for the two specific objectives. The larger sample was taken, the first sample size was determined by using a double population proportion formula by considering the following statistical assumptions: 95% CI, taking the prevalence of (p1) of 25.2% underweight among prisoners in Tigray prison [11] and prevalence (p2) 43% among prisoners living with HIV/AIDS. 95% confidence interval (Zα/2), 5% marginal error (d) and add 10% non-response rate.
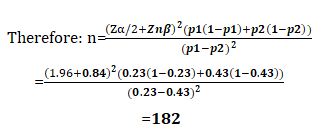
where p1 is proportion of undernutrition in Tigray prison, p2 is proportion of undernutrition in the prisoners living with HIV/AIDS in Kality prison, power = 0.84, confidence level = 1.96, 10% nonresponse rate added, and design effect 2, and the calculated sample size is equal to 182 for each and total sample size is 364. Under nutrition in the previous studies to select the factor having a maximum possible sample size by using 95% confidence interval and power 80% for all variables, so, the total sample size for this study is 364. Since the ratio is one to one, 182 from none infected and 182 from PLWHIV/AIDS will be selected and participate in the study. Sampling Technique and Procedure Multi-stage sampling technique was employed. In North Shoa, there are a total of 5 prisons one federal and four regional administration prisons. First each prison is stratified into Federal and regional administration prison. Then one Federal prison had been taken and two regional prisons were randomly select by lottery method to include in this study. There is a total of 5180 prisoner in the selected prisons. Mehalmeda prison (440), Debre Berhan Prison (1750) and Shoarobit prison (2990); Then estimate sample size for each prison was distributed proportionally to each section and final samples was draw using systematic random sampling method from registry identifying a list of prisoner. Study Variables Dependent variable
- Nutritional status
Independent variable Socio demographic characteristics
- Sex
- Age
- Educational status
- Marital status
- Religion
- Duration of stay in prison(Length of sentence / punishment)
Institutional factor
- Types of crime
- Drinking water source
- Scarcity of water
Behavioural and Personal related characteristics
- Social support
- Previous imprisonment history
- Alcohol use before jail
- Smoking before jail
- Chewing Khat before jail
- Provide additional diet
- Individual diet diversity
- Food frequency
- Feeding pattern
Medical factors
- Sero status
- Haemoglobin
- Any illness in the past 15 days
- Depression
- Major problems in daily life
- Digestive problem
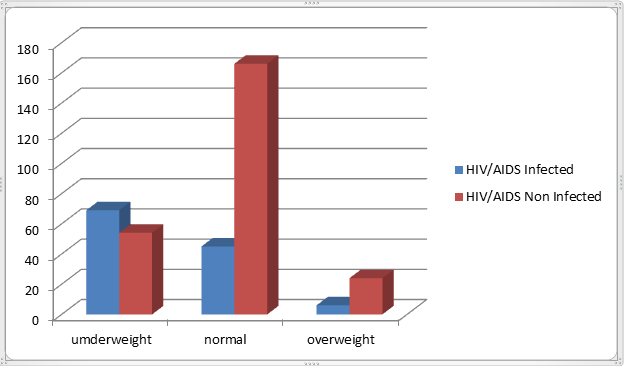
Operational definition Nutritional status: - For adults, body weight and height are used to evaluate overall nutrition status and to classify individuals as at healthy or unhealthy weight. BMI regardless of age or population, is normal at 18.5 to 25.0 kg/m2, overweight at 25.0 to 29.9 kg/m2 and obese at Over 30.0 kg/m2 [32]. Prison: is a facility also known as a correctional facility, jail goal penitentiary, detention centre, correctional centre [33]. Prison inmate: an individual who stayed in a prison for at least 6 months Prisoner food: the term for meals served to prisoner while incarcerated in correctional institutions [34]. Dietary intakes: Foods and drinks which are eaten to supply necessary nutritive elements. A prescribed course of eating and drinking in which the amount and kind of food, as well as the times at which it is to be taken, are regulated for therapeutic purposes. Food practices: refers to the myriad strategies that actors implement in constituting diet. Malnutrition: resulting from a reduced supply of food or from inability to digest, assimilate, and use the necessary nutrients. Undernutrition (BMI <18.5 kg/m2) Overweight (BMI 24.3 kg/m2) [35]. Poor social support: respondents scorning of 3-8 of the OSS-3(Oslo‐3 Social Support Scale) are considered as having poor social support. Moderate social support: respondents scoring of 9-11 of the OSS-3 are considered as having a moderate social support. Strong social support: respondents scoring of 12-14 of the OSS-3 are considered as having a strong social support. Depression Severity: is measured by using PHQ-9 with a 5 point severity scale over the last 2 weeks preceding the survey; based on the instrument standard PHQ-9 score ≥10 is considered as significant for meeting any form of depression diagnosed disorder. 1-4 Minimal depression , 5-9 Mild depression, 10-14 Moderate depression, 15-19 Moderately severe depression, 20-27 Severe depression. 24hrs recall: 24 hour dietary recall is detail information about all foods and beverages consumed by the respondent in the past 24 hours most commonly, from midnight to midnight the previous day. Dietary diversity score: relates to nutrient adequacy in which ≤ 3 food groups: poor. 4-6 food groups: medium. ≥ 7 food groups: Good. Anaemia is a decrease of Hgb values as compared to normal reference range for age and sex, physiologic condition, altitude, etc. Thus local normal reference values for female less than 12.5mg/dl and for male 13.5 mg/dl. Data collection method Data was collected by using interviewer administered pretested structured questionnaire. The questionnaires consist of five sections. Section A, solicited information about socio-demographic information. Section B, solicited information about behavioural characteristics, social support, and feeding practices such as IDD, food frequency and pattern. Section C, contain questions related to institutional factor like types of crime, drinking water source and Scarcity of water. Section D, addressed medical condition of prisoners: HIV-Sero status, depression, major problems in daily life, digestive problem. Section E, consisted anthropometries measurements of weight and height of individuals and hemoglobin level measurement. The questionnaire was prepared first in English language and then translated to Amharic language. 3 data collectors those who have diploma in nursing and 1 /BSc nurse were participate in the data collection process. Oslo‐3 Social Support Scale (OSS‐3) The 3‐item Oslo‐3 Social Support Scale (OSS‐3), which was also recommended for the ECHI according to the explanations of the OSS‐3 by Delgard 2008, the OSS‐3 can be used to calculate stand‐alone indicators for each of the three question items, moreover, to calculate a ‘social support sum score’, applying the score values to the answer categories. Check whether the OSS‐3 item sum score comprises valid values from 3 to 14. “A score ranging between 3 and 8 is classified as ‘poor support’, a score between 9 and 11 as ‘intermediate support’, and a score between 12 and 14 as ‘strong support’” [3]. Recode OSS‐3 sum score and generate a categorical variable of ‘social support’ in three categories. Depression Depression was measured by using PHQ-9, which has 9 items with a 5 point severity scale over last 2 weeks preceding the survey. Those who score ≥10 were considered as having depression disorder. Anthropometric measurements Standing height was measured when the subject was facing directly ahead. Shoes off, feet together and arm’s by the sides. Heels, buttocks and upper back should also be in contact with the wall when the measurement was made. Measuring body weight the person stands with minimal movement with hands by their side. Shoes and excess clothing should be removed. Weight and height was measure and BMI was calculated as weight/height (kg/m2). Body Mass Index (BMI) as the best method of measuring the nutritional status of prisoners will be used according to [35]. Haemoglobin measurements Haemoglobin measurement was measured by using hemo-cue from periphery (capillary) blood collected clean the fingertip with 70% alcohol and allow to dry puncture the fingertip (middle or ring finger) with a sterile lancet wipe away first 2 - 3 drops of blood put the tip of the micro cuvette in the drop of blood Fill the micro cuvette in one continuous process. The correct amount of blood (10 µl) is drawn into the micro cuvette. The micro cuvette should be completely filled then Switch on the machine press and hold left button. The display is activated. Optronic unit is automatically checked. The display shows 3 flashing dashes the analyser is ready to use. Pull out the cuvette holder Wipe away any excess of blood on the outside of the micro cuvette tip check for air bubbles in the filled micro cuvette. If present, use a new micro cuvette. Place the filled micro cuvette in the cuvette holder (within 10 minutes after filling the cuvette!) Push the cuvette holder to the measuring position after 15 - 60 seconds the result is displayed, read and record the result. Remove and discard the micro cuvette in the appropriate bio-hazard container. Push the cuvette holder back into the instrument. Data was collected by trained data collectors after attending two days training on the aim of the study, content, objective, data collection and interviewing technique and issue on confidentiality. During the data collection, regular supportive supervision and discussion with data collectors and supervisors was done. Data quality assurance Data quality was insured by translating the questionnaire from English to Amharic then back to English to see consistency. Pre-test was conducted on 5%of the study participants [32] in Ataye prison inmates. Training of data collectors was conducted for about 2 day to have consensus and the same understanding about the objective of the study, how to take measurement and how to approach participants ethically. The completeness, accuracy and consistency of the collected data were checked daily by responsible supervisor and principal investigator. Discussion was held based on the result of the pre-test and accordingly, some modifications were made. The validity and reliability of the tool was measured by crombach alpha test the statistic indicate 0.78. Data processing and analysis Data was cleaned, coded and entered into Epi-data Version 3.1 and then transferred to SPSS version 25.0 for further analysis. Anthropometric measurements were converted to BMI-to assess the nutritional status of the study subject then compared with the reference (WHO reference), BMI was computed by weight in kilogram divided by height in meter square (kg/m2). Descriptive statistics were presented with graphs and tables. The association between dependent and independent variables were analysed using Odds ratio with 95% confidence interval. The relative contribution of each variable to outcome of interest was assessed by logistic regression analysis to determine the effect of numerous factors on the outcome variable and to control confounding effect forward LR (logistic regression) methods was used. Variables with a P value < 0.25(11). In bivariate analysis was transferred to multivariate analysis those variables with p-value of less than 0.05 in multivariate analysis were considered as significant. Hosmer-Lemeshow goodness-of-fit statistics was conducted to determine whether the model adequately describes the data. The statistic indicates a good fit the significance value is 0.97. Ethical consideration Ethical clearance was obtained from the Ethical Review Board of Debre Berhan health Science College. Written letter for the next steps was secured from North Shoa prison administration office. Consent will be obtained from each study participants after informing them all the purpose, benefit, risk, the confidentiality of the information and the voluntary nature of the participation in the study. They will also being informed about their right not to respond for questions they will not want to answer. To assure the confidentiality of the response, nameless interview will be conducted. Dissemination and utilization of results The result of this study will be presented to Debre Berhan Health Science College then it will be summated to the research commute of DBHSC and it will be submitted to all north Shoa prisons administrative office and other who are concerned at regional or federal level. It will be also presented at seminar and workshops, and submitted to different journal for publications. RESULT Socio-Demographic Characteristics of the Respondents A total of 364 prison inmates were interviewed in the study (33% from PLHIV and 67% from none HIV infected), with response rate of 100%; the mean ± standard deviation, with range of age of the respondents was 39.12 (±12.1) years, ranging from 18 to 65 years. One hundred six (29.1%) of the participants were in the age group of 30 to 39 years. About 143(39.3%) prison inmates were married and most of them 262(72.0 %) were Christian Orthodox. Nearly one third of the participants 141(38.7%) had informal education. One hundred seventy seven participants (48.6%) were living in prison for duration of 25 -60 months. (Table1).
Table 1: Socio demographic characteristics of prisoner in north Shoa prison, Ethiopia, 2020. (n= 364).
|
Variables |
Characteristics |
Frequency |
Present (%) |
|
Sex |
Male |
332 |
91.2 |
|
Female |
32 |
8.8 |
|
|
Age |
18-29 |
96 |
26.4 |
|
30-39 |
106 |
29.1 |
|
|
40-49 |
88 |
24.2 |
|
|
>50 |
74 |
20.3 |
|
|
Religion |
Orthodox |
262 |
72.0 |
|
Muslim |
60 |
16.5 |
|
|
Protestant |
34 |
9.3 |
|
|
Others |
8 |
2.2 |
|
|
Marital status |
Single |
134 |
36.8 |
|
Married |
143 |
39.3 |
|
|
Divorced |
71 |
19.5 |
|
|
Windowed |
16 |
4.4 |
|
|
Educational status |
Unable to read and write |
62 |
17.0 |
|
Informal education |
141 |
38.7 |
|
|
Primary education |
103 |
28.3 |
|
|
Secondary education |
44 |
12.1 |
|
|
College level and above |
14 |
3.8 |
|
|
Duration of jail |
6 months -12 months |
32 |
8.8 |
|
13 months -24 months |
67 |
18.4 |
|
|
25 months -60 months |
177 |
48.6 |
|
|
≥ 61 months |
88 |
24.2 |
Table 2: Socio demographic characteristics of PLHIV prisoner in north Shoa prison, Ethiopia, 2021(n= 120).
|
Variables |
Characteristics |
Frequency |
Present (%) |
|
Sex |
Male |
100 |
83.3 |
|
Female |
20 |
16.7 |
|
|
Age |
18-29 |
25 |
20.8 |
|
30-39 |
33 |
27.5 |
|
|
40-49 |
33 |
27.5 |
|
|
>50 |
29 |
24.2 |
|
|
Religion |
Orthodox |
78 |
65.0 |
|
Muslim |
23 |
19.2 |
|
|
Protestant |
14 |
11.7 |
|
|
Others |
5 |
4.2 |
|
|
Marital status |
Single |
40 |
33.3 |
|
Married |
46 |
38.3 |
|
|
Divorced |
26 |
21.7 |
|
|
Windowed |
8 |
6.7 |
|
|
Educational status |
Unable to read and write |
19 |
15.8 |
|
Informal education |
48 |
40.0 |
|
|
Primary education |
37 |
30.8 |
|
|
Secondary education |
10 |
8.3 |
|
|
College level and above |
6 |
5.0 |
|
|
Duration of jail |
6 months -12 months |
10 |
8.3 |
|
13 months -24 months |
26 |
21.7 |
|
|
25 months -60 months |
51 |
42.5 |
|
|
≥ 61 months |
33 |
27.5 |
Socio-demographic characteristics of the negative Sero-status respondents
Out of participants seventy three (29.9%) of the participants were in the age group of 30 to 39 years. About 97(39.8%) prison inmates were married and most of them 184(75.4 %) were Christian Orthodox. Nearly one third of the participants 93(38.1%) had informal education. One hundred twenty six participants (51.6%) were living in prison for duration of 25 -60 months. (Table3).
Table 3: Socio demographic characteristics of negative Sero-status prisoner in north Shoa prison, Ethiopia, 2021(n= 244).
|
Variables |
Characteristics |
Frequency |
Present (%) |
|
Sex |
Male |
232 |
95.1 |
|
Female |
12 |
4.9 |
|
|
Age |
18-29 |
71 |
29.1 |
|
30-39 |
73 |
29.9 |
|
|
40-49 |
55 |
22.5 |
|
|
>50 |
45 |
18.4 |
|
|
Religion |
Orthodox |
184 |
75.4 |
|
Muslim |
37 |
15.2 |
|
|
Protestant |
20 |
8.2 |
|
|
Others |
3 |
1.2 |
|
|
Marital status |
Single |
94 |
38.5 |
|
Married |
97 |
39.8 |
|
|
Divorced |
45 |
18.4 |
|
|
Windowed |
8 |
3.3 |
|
|
Educational status |
Unable to read and write |
43 |
17.6 |
|
Informal education |
93 |
38.1 |
|
|
Primary education |
66 |
27.0 |
|
|
Secondary education |
34 |
13.9 |
|
|
College level and above |
8 |
3.3 |
|
|
Duration of jail |
6 months -12 months |
22 |
9.0 |
|
13 months -24 months |
41 |
16.8 |
|
|
25 months -60 months |
126 |
51.6 |
|
|
≥ 61 months |
55 |
22.5 |
Out of the total respondents, 8(6.7%) were cigarette smoker before jail, 25(20.8%) had history of chewing Khat, 45(37.5%) were alcohol users. Majority of respondents 59(49.2%) had poor social support and 95(79.2%) didn’t get additional diet. Most of the respondents 78(65.0%) ate three times per day. The average individual diet diversity score of study participants was 2.81±0.62 SD (Table 4).
Table 4: Behavioural and feeding characteristics of prison PLHIV inmates in North Shoa prison, Ethiopia, 2021 (n=120).
|
Variables Characteristics |
Frequency |
Present (%) |
|
|
Smoking status before jail |
No |
112 |
93.3 |
|
Yes |
8 |
6.7 |
|
|
Chewing Khat before jail |
No |
95 |
79.2 |
|
Yes |
25 |
20.8 |
|
|
Alcohol use before jail |
No |
75 |
62.5 |
|
Yes |
45 |
37.5 |
|
|
Social support |
Poor social support |
59 |
49.2 |
|
Moderate social support |
42 |
35.0 |
|
|
Strong social support |
19 |
15.8 |
|
|
Previous jail history |
No |
89 |
74.2 |
|
Yes |
31 |
25.8 |
|
|
Provide additional diet |
Yes |
25 |
20.8 |
|
No |
95 |
79.2 |
|
|
Frequency of fruit |
Three times or more/week |
18 |
15.0 |
|
Two times/week |
20 |
16.7 |
|
|
One times/week |
18 |
15.0 |
|
|
Nothing/week |
64 |
53.3 |
|
|
Frequency of Milk & milk |
One or more times/week |
26 |
21.7 |
|
Nothing/week |
94 |
78.3 |
|
|
Frequency of Meat |
Three times or more/week |
26 |
21.7 |
|
Two times/week |
11 |
9.2 |
|
|
One times/week |
20 |
16.7 |
|
|
Nothing/week |
63 |
52.5 |
|
|
Feeding pattern per day |
Once |
3 |
2.5 |
|
Twice |
28 |
23.3 |
|
|
Three times |
78 |
65.0 |
|
|
Four times or more |
11 |
9.2 |
|
|
Number of food items using in the last 24 hours |
≤ 3 food items |
98 |
81.7 |
|
4-5 food items |
20 |
16.7 |
|
|
≥ 6 food items |
2 |
1.7 |
|
Behavioral and feeding characteristics of negative Sero-status prisoners
Majority of respondents 183(75.0%) had poor social support and 220(90.2%) didn’t get additional diet. From the total respondents, 21(8.6%) were cigarette smoker before jail, 59(24.2%) had history of chewing Khat, 122(50.0%) were alcohol users. Most of the respondents 177(72.5%) ate three times per day (Table 5).
Table 5: Behavioural and feeding characteristics of prisoner negative Sero-status inmates in North Shoa prison, Ethiopia, 2021 (n=244).
|
Variables Characteristics |
Frequency |
Present (%) |
|
|
Smoking status before jail |
No |
223 |
91.4 |
|
Yes |
21 |
8.6 |
|
|
Chewing Khat before jail |
No |
185 |
75.8 |
|
Yes |
59 |
24.2 |
|
|
Alcohol use before jail |
No |
122 |
50.0 |
|
Yes |
122 |
50.0 |
|
|
Social support |
Poor social support |
183 |
75.0 |
|
Moderate social support |
46 |
18.9 |
|
|
Strong social support |
15 |
6.1 |
|
|
Previous jail history |
No |
198 |
81.1 |
|
Yes |
46 |
18.9 |
|
|
Provide additional diet |
Yes |
24 |
9.8 |
|
No |
220 |
90.2 |
|
|
Frequency of fruit |
Three times or more/week |
15 |
6.1 |
|
Two times/week |
23 |
9.4 |
|
|
One times/week |
28 |
11.5 |
|
|
Nothing/week |
178 |
73.0 |
|
|
Frequency of Milk & milk |
One or more times/week |
7 |
2.9 |
|
Nothing/week |
237 |
97.1 |
|
|
Frequency of Meat |
Three times or more/week |
8 |
3.3 |
|
Two times/week |
37 |
15.2 |
|
|
One times/week |
25 |
10.2 |
|
|
Nothing/week |
174 |
71.3 |
|
|
Feeding pattern per day |
Once |
5 |
2.0 |
|
Twice |
43 |
17.6 |
|
|
Three times |
177 |
72.5 |
|
|
Four times or more |
19 |
7.8 |
|
|
Number of food items using in the last 24 hours |
≤ 3 food items |
200 |
82.0 |
|
4-5 food items |
28 |
11.5 |
|
|
≥ 6 food items |
16 |
6.6 |
|
Institutional conditions Among the total participants, the majority (40.8%) sero- negative and 41.8% PLHIV were murder. Less than half of the respondents did not get sufficient food. Eighteen four (70.0%) of PLHIV and one hundred sixteen nine (69.3%) from negative sero- status had scarcity of water (Table 6).
Table 6: Institutional conditions among the negative sero- status and PLHIV/AIDS respondents in North Shoa prison, Ethiopia, 2021 (n=364).
|
Variable Characteristics |
PLHIV/AIDS |
Negative sero status |
|||
|
Frequency |
Present |
Frequency |
Present |
||
|
Type of crime |
Murder |
49 |
40.8 |
102 |
41.8 |
|
Theft |
35 |
29.2 |
76 |
31.1 |
|
|
Physical harm |
20 |
16.7 |
43 |
17.6 |
|
|
Other |
16 |
13.3 |
23 |
9.4 |
|
|
Food shortage |
Yes |
36 |
30.0 |
99 |
40.6 |
|
No |
84 |
70.0 |
145 |
59.4 |
|
|
Scarcity of water |
Yes |
84 |
70.0 |
169 |
69.3 |
|
No |
36 |
30.0 |
75 |
30.7 |
|
|
Drinking water source |
Public water supply |
120 |
100.0 |
244 |
100.0 |
Medical factors and related characteristics Medical factors and related characteristics of PLHIV Most of the respondents 49(40.8%) of a major problem in daily life were frequently ill, According to the responses of the study groups majority of the respondents 29(24.2%) respondents Severe depressed based on PHQ-9, 28 (23.3%) have minor depression disorder but some of the respondents had Anaemia 18.3% (Table 7)
Table 7: Medical factors and related characteristics among the PLHIV respondents in North Shoa prison, Ethiopia, 2021 (n=120).
|
Variable characteristic |
Frequency |
Present |
|
|
Illness |
Yes |
50 |
41.7 |
|
No |
70 |
58.3 |
|
|
Major problems in daily life |
Frequent ill |
49 |
40.8 |
|
Little food |
26 |
21.7 |
|
|
Poor or inadequate water supply |
27 |
22.5 |
|
|
None |
18 |
15.0 |
|
|
Haemoglobin |
Anaemic |
65 |
54.2 |
|
Non anaemic |
55 |
45.8 |
|
|
Depression |
Minimal depression |
28 |
23.3 |
|
Mild depression |
20 |
16.7 |
|
|
Moderate depression |
19 |
15.8 |
|
|
Moderately severe depression |
24 |
20.0 |
|
|
Severe depression |
29 |
24.2 |
|
|
Digestion problems |
Yes |
15 |
12.5 |
|
No |
105 |
87.5 |
|
Out of the respondents 104(42.6%) of a major problem in daily life were frequently ill. From the responses of the study groups majority of the respondents 62(25.4%) respondents moderate depressed based on PHQ-9, 55 (22.5%) have mild depression disorder but greater than half of the respondents had Anaemia 159( 65.2%) (Table 8)
Table 8: Medical factors and related characteristics among the negative sero-status respondents in North Shoa prison, Ethiopia, 2021 (n=244).
|
Variable characteristic |
Frequency |
Present |
|
|
Illness |
Yes |
64 |
26.2 |
|
No |
180 |
73.8 |
|
|
Major problems in daily life |
Frequent ill |
104 |
42.6 |
|
Little food |
43 |
17.6 |
|
|
Poor or inadequate water supply |
48 |
19.7 |
|
|
None |
49 |
20.1 |
|
|
Haemoglobin |
Anaemic |
124 |
50.8 |
|
Non anaemic |
120 |
49.2 |
|
|
Depression |
Minimal depression |
50 |
20.5 |
|
Mild depression |
55 |
22.5 |
|
|
Moderate depression |
62 |
25.4 |
|
|
Moderately severe depression |
40 |
16.4 |
|
|
Severe depression |
37 |
15.2 |
|
|
Digestion problems |
Yes |
22 |
9.0 |
|
No |
222 |
91.0 |
|
Prevalence of under nutrition The mean body mass index of the participants were 20.97kg/m2 with (SD=±2.93). Among the total participants 123(33.8%) were under nourished (BMI <18.5kg/m2)
|
Variables Categories |
Nutritional status |
COR(95%CI) |
AOR(95%CI) |
||
|
No |
Yes |
||||
|
Age |
18-29 |
8 |
17 |
1 |
1 |
|
30-39 |
19 |
14 |
0.347((0.117-1.029) |
0.180(0.038-.844) ** |
|
|
40-49 |
16 |
17 |
0.5000(.169-1.476) |
0.321(0.075-1.373) |
|
|
>50 |
8 |
21 |
1.235(.383-3.981) |
1.928(0.468-7.949) |
|
|
Hgb |
Anaemic |
15 |
50 |
6.316(2.835-14.072) |
4.464(1.556-12.811)** |
|
|
None anaemic |
36 |
19 |
1 |
1 |
|
Social Support |
No |
17 |
50 |
5.263(2.398-11.552) |
6.281(2.153-18.321) ** |
|
Yes |
34 |
19 |
1 |
1 |
|
|
Meat Eating per Week |
Three times or more |
2 |
24 |
1 |
1 |
|
Two times |
6 |
5 |
14.0(3.061-64.662) |
0.107(0.010-1.138) |
|
|
One times |
9 |
11 |
0.977(0.270-3.535) |
0.091(0.011-.792) |
|
|
Nothing |
34 |
29 |
1.433(.522-3.937) |
0.123(0.017-.872) |
|
|
Alcohol users |
No |
41 |
30 |
1 |
1 |
|
Yes |
10 |
39 |
5.330(2.303-12.337) |
3.048(1.037-8.965) ** |
|
|
Variables Categories |
Nutritional status |
||||
|
No |
Yes |
COR(95%CI) |
AOR(95%CI) |
||
|
1 |
Anaemic |
84 |
40 |
3.605(1.840-7.064) |
3.749(1.748-8.041)** |
|
None anaemic |
106 |
14 |
1 |
1 |
|
|
2 |
Minimal depression |
37 |
13 |
1 |
1 |
|
3 |
Mild depression |
54 |
1 |
.053(.007-.420) |
.075(.009-.617) ** |
|
4 |
Moderate depression |
46 |
16 |
.990(.423-2.317) |
1.231(.490-3.094) |
|
5 |
Moderately severe depression |
36 |
4 |
0.316(0.094-1.062) |
.338(.094-1.213) |
|
6 |
Severe depression |
17 |
20 |
3.348(1.356-8.269) |
3.917(1.437-10.679) ** |
|
7 |
No |
131 |
48 |
3.603(1.461-8.885) |
3.750(1.358-10.349)** |
|
8 |
Yes |
59 |
6 |
1 |
1 |
|
9 |
No |
150 |
35 |
1 |
1 |
|
10 |
Yes |
40 |
19 |
2.036(1.054-3.933) |
1.758(.759-4.071) |
|
11 |
No |
123 |
24 |
1 |
1 |
|
Yes |
67 |
30 |
2.295(1.242-4.239 |
1.613(.760-3.420) |
|
|
Variables Categories |
Nutritional status |
COR(95%CI) |
AOR(95%CI) |
||
|
No |
Yes |
||||
|
Age |
18-29 |
61 |
35 |
1 |
1 |
|
30-39 |
79 |
27 |
.596(.326-1.089) |
.468(.227-.964) |
|
|
40-49 |
59 |
29 |
.857(.466-1.574) |
.874(.426-1.792) |
|
|
>50 |
42 |
32 |
1.328(.714-2.468) |
1.434(.689-2.984) |
|
|
Sex |
Male |
225 |
107 |
0.476(0.229-0.987) |
.375(.145-.970) ** |
|
Female |
16 |
16 |
1 |
1 |
|
|
Hgb |
Anaemic |
99 |
90 |
3.912(2.434-6.286) |
3.269(1.908-5.600)** |
|
None anaemic |
142 |
33 |
1 |
1 |
|
|
Alcohol |
No |
164 |
54 |
1 |
1 |
|
Yes |
77 |
69 |
2.722(1.74-4.257) |
2.312(1.375-3.889) ** |
|
|
Social Support |
No |
148 |
98 |
2.463(1.479-4.102) |
3.443(1.831-6.474) ** |
|
Yes |
93 |
25 |
1 |
1 |
|
|
Meat Eating per Week |
Three times or more |
9 |
25 |
1 |
1 |
|
Two times |
28 |
20 |
0.257(0.099-0.667) |
0.402(0.1251-0.287) |
|
|
One times |
31 |
14 |
0.163(0.060-0.437) |
0.171(0.052-0.558) |
|
|
Nothing |
173 |
64 |
0.133(0.059-0.301) |
0.183(0.068-0.492) |
|
|
Frequency of Milk/week |
One or more times |
11 |
22 |
1 |
1 |
|
Nothing/week |
230 |
101 |
0.220(0.103-0.470) |
0.212(0.086-0.521) |
|
- Walmsley R. (2013). World Prison Population List. London:International Centre for Prison Studies.
- Mwakyoso ML. (2013). Nutritional assessment of prisoners living with HIV/AIDS in selected prisons in Tanzania:134.
- Harrison NP, M. Allen J. (2012). Prison and jail inmates at midyear Bureau of Justice Statistics, Canberra: 99-102.
- Coates. (2014). Factors Affecting Nutritional Status of the Elderly:305-306.
- Fawzi WW, Msamanga GI, Spiegelman D, Wei R, Kapiga S, Villamor E, Mwakagile D, et al. (2004). Randomized Trial of Multivitamin Supplements and HIV Disease Progression and Mortality. N Engl J Med. 351:23–32.
- Akuzawa N, Naito H. (2015). Nutritional parameters affecting severity of pneumonia and length of hospital stay in patients with pneumococcal pneumonia retrospective cross-sectional study. BMC Pulm Med. 15: 149.
- Moges B, Amare B, Asfaw F, Tesfaye W, Tiruneh M, Belyhun Y, et al. (2012). Prevalence of smear positive pulmonary tuberculosis among prisoners in North Gondar Zone Prison, northwest Ethiopia. BMC Infect Dis. 12:352.
- Monlezun DJ, Bittner EA, Christopher KB, Camargo CA, Quraishi SA. (2015). Vitamin D status and acute respiratory infection: cross sectional results from the United States National Health and nutrition examination survey. 3:44.
- WHO. (2019). Anemia privalence and Etiology among women and men springer nature.
- Gould C, Tousignant B, Brian G, McKay R, Gibson R, Bailey K, et al. (2013). Cross-sectional dietary deficiencies among aprison population in Papua New Guinea. BMC Int Health Hum Rights. 13:21.
- Abera SF, Adane K. (2017). One-fourth of the prisoners are underweight in Northern Ethiopia: a crosssectional study. BMC Public Health. 17(1):449.
- World Prison Brief IfCPR. (2015). World Prison Population List.
- MG. (2013). Prevalence of Under-nutrition among the Juangs. J Anthropol.
- Maertens J. (2011). Barriers to Nutrition management among people living with HIV on Antiretroviral Therapy. Dissertation for Doctor for philosophy.
- Prodhan UK. (2017). Effect of Dietary Pattern on Nutritional Status of Prisoner. J Nursing Health Sci.:50.
- Herbert K, Plugge E, Foster C, Doll H. (2012). Prevalence of risk factors for non-communicable diseases in prison populations worldwide a systematic review. Lancet. 379(9830):1975-1982.
- Lantonirina Ravaoarisoa AHP. (2019). Nutritional status of female prisoners in Antanimora prison, Madagascar. Pan Afr Med J:44.
- nations u. United nation universal declaration of human rights. 1948.
- Tamang K. Factors affecting nutritional status among elderly people of rural Nepal. Nutrition Congress. 2017:104.
- UN Fo. Food and nutrition. creating a well-fed world 2012:38.
- Qadir M, Murad R, Qadir A, Muhammad S. (2014). A Health and Nutritional Perspective.:19(2).
- Rahman A, Alam R, Islam MS, Prodhan UK. (2017). Effect of Dietary Pattern on Nutritional Status of Prisoner. IOSR. 6:50.
- Gould C, Tousignant B, Brian G, McKay R, Gibson R, Bailey K, et al. (2013). Cross-sectional dietary deficiencies among aprison population in Papua New Guinea. BMC International Health and Human Rights:7.
- Mwakyoso. (2013). Nutritional assessment of prisoners living with HIV/AIDS in selected prisons in Tanzania:134.
- Kavithe KR, David-Kigaru DM, Maoga WN. (2018). Dietary intake and factors affecting food service of male prisoners living with human immunodeficiency virus at selected prisons in Kenya. Int J Nutri Metab: 10(2):6-15
- Birhanu MDFMD. (2013). Nutritional status and associated factors among adult HIV/AIDS clients in Felege Hiwot Referral Hospital,Bahir Dar, Ethiopia. Sci J Public Health:26.
- Tsebaot Kassa AAaMT. (2017). Assessment of Nutritional Status and Associated Factors among Prisoners Living with HIV/AIDS in Kality Prison, Addis Ababa, Ethiopia. J AIDS Clin Res. 8 (6):27.
- Ferede S. (2017). One-fourth of the prisoners are underweight in Northern Ethiopia: a cross-sectional study. BMC Public Health:28.
- Zemede Z. (2019). Undernutrition and associated factors open access to scientific and medical research.
- Belay B. (2011). Assessment of nutritional status and associated factors among adults living with HIV/AIDS in addis ababa, Ethiopia:33.
- Thapaet. (2015). Nutritional status and its association with quality of life among people living with HIV attending public anti-retroviral therapy. AIDS Research and Therapy.
- WHO. (2012). Assessment of nutritional status. Explore Encyclopediacom.
- John. (2009). A history of criminals justice in England and Wales. Water side pres:157.
- Benjamin L. (2015). Do prison inmates have a right to vegetarian meals.
- WHO. (2012). Healthy weight Assessing your weight BMI. Center for disease control and prevention 6.
- Kerkhoff AD, Wood R, Cobelens FG, Gupta-Wright A, Bekker LG, Lawn SD.(2014). Resolution of anaemia in a cohort of HIV-infected patients with a high prevalence and incidence of tuberculosis receiving antiretroviral therapy in South Africa. BMC Infect Dis. 14:3860.