Previous Issues Volume 2, Issue 2 - 2017
A Cross-Sectional Prospective Study of Glycated Hemoglobin (Hba1c) and Fasting Blood Glucose (Fbg) Level In Both Diabetic and Non-Diabetic Patients in Context to Nepalese General Population
Prachand Man Singh Rajbhandari, Prabin Gyawali, Ram Vinod Mahato, Dipesh Chaudhary, Shubhash Paudel, Nani Kaji Deshar, Niranjan Koirala*
Department of Medical Biochemistry, Faculty of Science and Technology, Nobel College, Pokhara University, Kathmandu, Nepal.
Corresponding Author: Niranjan Koirala, Head of the Department, Medical Biochemistry, Nobel College, Pokhara University, Kathmandu, Nepal, Tel: +977(1)4110525; E-Mail: [email protected]
Received Date: 03 Apr 2017 Accepted Date: 19 Apr 2017 Published Date: 21 Apr 2017
Copyright © 2017 Koirala N
Citation: Rajbhandari PMS, Gyawali P, Mahato RV, Chaudhary D, et al. (2017). A Cross-Sectional Prospective Study of Glycated Hemoglobin (Hba1c) and Fasting Blood Glucose (Fbg) Level In Both Diabetic and Non-Diabetic Patients in Context to Nepalese General Population.Mathews J Diabetes Obes. 2(2): 007.
ABSTRACT
Blood samples were tested for Fasting Blood Glucose (FBG) and Glycated Haemoglobin (HbA1c) from 75 patients visiting the OPD at Dhulikhel Hospital, Dhulikhel, Kavre, Nepal from 1st August 2010 to 30th October 2010. In the total sample of 75, 49 (65.3%) were male, 26 (34.7%) were female. The age range from 23 to 81 years the mean ± SD of age was found to be 54.81 ±12.287. The mean ± SD of HbA1c was found to be 7.43 ± 2.324 and for fasting blood sugar the mean ± SD was found to be 155.91 ± 67.931. Pearson correlation between fasting blood sugar and HbA1c was found to be (r= 0.683), which indicates the strong and positive correlations and the P value for these variables was (P<0.01 i.e. 0.000000000153), which was significant. Taken together our cross sectional study demonstrates that the HbA1c has a very good correlation with FBG level.
KEYWORDS
HbA1c; Fasting Blood Glucose; Correlation; P Value; Cross Sectional Study.
INTRODUCTION
The term Diabetes Mellitus (DM) describes a metabolic disorder of multiple etiology characterized by chronic hyperglycemia with disturbances of carbohydrate, fat and protein metabolism resulting from defects in insulin secretion, insulin action, or both [1]. Several distinct types of DM exist and are caused by a complex interaction of genetics, environmental factors, and life-style choices. Depending on the etiology of the DM, factors contributing to hyperglycemia may include reduced insulin secretion, decreased glucose utilization, and increased glucose production [2]. The effects of diabetes mellitus include long-term damage, dysfunction and failure of various organs. The long-term effects of diabetes mellitus include progressive development of the specific complications of retinopathy with potential blindness, nephropathy that may lead to renal failure, and/or neuropathy with risk of foot ulcers, amputation, Charcot joints, and features of autonomic dysfunction, including sexual dysfunction. [3] People with diabetes are at increased risk of cardiovascular, peripheral vascular and cerebrovascular disease. [1]. The burden of type 2 diabetes has a rising trend in the world. The worldwide prevalence of diabetes among general population was estimated at 150 millions in 1995, and this is projected to increase to 300 million by 2025 [4]. Developing countries such as most of the Asian countries are experiencing an accelerated rate in this issue [5]. It is estimated that about one third of people with type 2 diabetes might be undiagnosed until the complications are developed [6]. Therefore, establishing efficient screening programs to detect people with undiagnosed diabetes is important. In order to detect diabetics, fasting blood glucose (FBS) is suggested as the best and the most common test with the cutoff point >126 mg/dl [5]. However, there are some issues about using FBS such as keeping the clients fast for about 8 hours and not being applicable in the afternoon. Besides, in centralized screening when laboratory facilities are available, HbA1c test, which is the percentage of glycated hemoglobin is recommended to measure the incidence or prevalence [5]. Apart from the efficacy of HbA1c in detection of diabetes, it is an important marker to assess the microvascular complications and plasma glucose [7]. The relationship between HbA1c and blood glucose is documented in the literature denoting a straight relationship [8]. However, this relationship has not been confirmed by others [9]. There is a controversy about the performance of HbA1c in case finding. It has been argued that due to problems in standardization and variations in styles of HbA1c test, it is not recommended as a routine test for screening of diabetes. In addition, other factors such as abnormal hemoglobin, anemia and some drugs may affect the results of HbA1c test [7]. Also, demographic factors such as race and gender are other effective factors [10]. Saudek and his colleagues compared FBS and HbA1c as screening tests. They argued that HbA1c is preferable because it is more time-flexible and informative in long-term conditions. Their criterions have been stabilized in recent years [11]. However, in an epidemiological study, it has been concluded that FBS is more accurate than HbA1c [12]. The best cutoff point for defining high HbA1c is another important issue. The Diabetes Control and Complications Trial suggested the value of 6% as HbA1c cut point [13]. The United Kingdom Prospective Diabetes Study considered 6.2 as the normal level [14], while many laboratories consider 4-6 as a normal range [15]. It seems that in different settings such as screening, diagnosis and prediction of progression of diabetes we need to define different cut off points. For example, It is suggested the value of 6.5% or greater as a diabetes diagnostic criterion and 6% and 4.7 for screening test [11]. Inoue and his colleagues used the value of 5.8% for the prediction of progression of diabetes type 2 [16], and the value <7 as a good predictive of satisfactory blood glucose control in type 1 diabetes [17]. The main aim of major primary studies carried out in diabetes in Nepal was to recognize the range of HbA1c in the diabetics, tracing back the complications of diabetes and diabetes control [18]. A few researches have been carried out to find out the cutoff value of HbA1c in screening; however, they mainly used a selective samples mainly focusing on high risk groups [19], Furthermore, a study has determined the normal range of HbA1c in a sample of non-diabetics [20]. Based on the above explanation and to fill the gaps, hemoglobin (HbA1c) and fasting blood glucose level in uncontrolled diabetes mellitus in context to Nepalese patients was studied.
MATERIALS AND METHODS
Study type
This was the prospective cross sectional study. All the patients who meet inclusion criteria were taken as study population.
Study site
Study was conducted in Dhulikhel Hospital-KUH, Kavre district, Nepal. Study Population and Inclusion and Exclusion Criteria. The study population of this study was cross sectional.
Inclusion criteria
Patient not suffering from any mental illness and malignant diseases.
Exclusion criteria
- Abnormal hemoglobinopathies, including variant hemoglobins, sickle cell disease, homozygous HBC disease, HBSC disease, and β thalassemia.
- Pregnancy induced diabetes.
- Critically ill patients.
Study method Quantitative Study subjects Patient attending outpatient department (OPD) and wards of Hospital. Sample size 75 samples were taken randomly and purposively. Study duration Study was conducted for the duration of 3 month from 1st August 2010 to 30th October 2010. Instrumentation Laboratory investigation. Specimen collection and storage For Glucose Estimation
Venous blood was collected using tourniquet and was kept in test tube. The blood sample collected in test tube was quickly centrifuged and brought to laboratory for estimation of serum biochemical parameters.
For Hemoglobin A1c test Specimen Collection
No special additives or preservatives other than anticoagulants were required. Venous blood with EDTA was collected using aseptic technique. All human specimens were regarded as potentially biohazardous. Therefore, universal precautions was used in specimen handling (gloves, lab garments, avoid aerosol production, etc).
Specimen storage
HbA1c in whole blood collected with EDTA was stable for one week at 2- 8°C.
Estimation of HbA1c
HbA1c was estimated by using NycoCard HbA1c. It is a rapid in vitro test for the measurement of glycated hemoglobin (%HbA1c) in human whole blood. NycoCard HbA1c is a boronate affinity assay. The kit contains test devices with a porous membrane filter, test tubes prefilled with reagent and a washing solution. The reagent contains agents that lyse erythrocytes and precipitate hemoglobin specifically, as well as blue boronic acid conjugate that binds cis-diols of glycated hemoglobin. When blood was added to reagent, the erythrocytes immediately lysed. All hemoglobin precipitates. The boronic acid conjugate binds to the cis-diol configuration of glycated hemoglobin. An aliquot of reaction mixture was added to test device, and all the precipitated hemoglobin, conjugate-bound and unbound, remained on top of the filter. Any excess of colored conjugate was removed with washing solution. The precipitate was evaluated by measuring the blue (gycated hemoglobin) and the red (total hemoglobin) color intensity with the NycoCard READER II, the ratio between them being proportional to the percentage of HbA1c in the sample.
Estimation of Blood Glucose
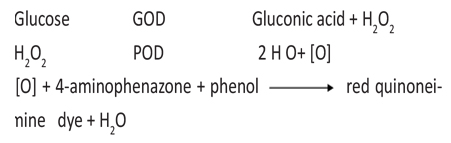
Glucose was estimated by using glucose oxidase peroxidase (GOD/POD) method. Glucose is oxidized to gluconic acid and hydrogen peroxide in the presence of glucose oxidase. Hydrogen peroxide further reacts with phenol and 4- aminoantipyrine by the catalytic action of peroxidase to form a red colored quinoneimine dye complex. Intensity of color formed is directly proportional to the amount of glucose present in the sample.
 Ethical considerations
- Approval from institution was taken before carrying out study.
- Before drawing blood, verbal consent of parents was taken.
- The parents who refuse to give consent were not included in the study.
Reliability and validity
- Appropriate sample size was selected.
- Standard study design was applied.
Data analysis
Statistical Correlation between HbA1c and Fasting blood glucose was assessed by using SPSS software (version 14.0, SPSS, Chicago, USA).
RESULTS
In the sample of 75 patients, fasting blood sugar and HbA1c were analyzed to determine the correlation between fasting blood sugar and HbA1c, and to predict the diabetic complications. In the total sample of 75, 49(65.3%) were male, 26 (34.7%) were female. The age range from 23 to 81 years the mean ± S.D of age was found to be 54.81 ±12.287. Among 75 patient observed, 18(62.1%) had blood sugar <126 mg/dl and HbA1c <6.3, 11(37.9%) had blood sugar >126 mg/ dl and HbA1c <6.3, similarly 15(32.6%) had blood sugar <126 mg/dl and HbA1c >6.3, 31(67.4%) had blood sugar >126 mg/ dl and HbA1c >6.3 (Table 1).
Table 1: HbA1c and fasting blood sugar cross tabulation.
| HbA1c % | No. of patients and percent | fasting blood sugar | Total | |
| <126 mg/dl | >126mg/dl | |||
| < 6.3 | Count % within HbA1c | 18 62.1% | 11 37.9% | 29 100.0% |
| > 6.3 | Count % within HbA1c | 15 32.6% | 31 67.4% | 46 100.0% |
| Total | Count % within HbA1c | 33 44.0% | 42 56.0% | 75 100.0% |
The (mean ±S.D) of age was found to be 54.81 ± 12.287 in the total sample of 75 patients. The (mean ±S.D) of fasting blood sugar was found to be 155.91 ± 67.931. Where 45.5 % [5] had blood sugar 126 mg/dl and age was 40 years of age having blood sugar 126 mg/dl who were >40 years of age. The (mean ±S.D) of HbA1c was found to be 7.43 ± 2.324 where there was 63.6 % [7] having age 6.3% ,34.4%[22] had HbA1c < 6.3% and age was >40 years,65.6%[42] had age >40 years and HbA1c >6.3%. (Table 2, 3 and 4).
Table 2: Distribution of fasting blood sugar and HbA1c according to age.
| Parameters | N | Minimum | Maximum | Mean | Std. Deviation |
| Age | 75 | 23 | 81 | 54.81 | 12.287 |
| HbA1c | 75 | 4 | 15 | 7.43 | 2.324 |
| FBS | 75 | 66 | 355 | 155.91 | 67.931 |
| Valid N (list wise) | 75 |
Table 3: Age wise distribution of fasting blood sugar level.
| Age | No. of patients and percentage within age | fasting blood sugar | Total | |
| <126 mg/dl | >126mg/dl | |||
| <40 | Count % within HbA1c | 5 45.5% | 6 54.5% | 11 100.0% |
| >40 | Count % within HbA1c | 28 43.8% | 36 56.2% | 64 100.0% |
| Total | Count % within HbA1c | 33 44.0% | 42 56.0% | 75 100.0% |
Table 4: Age wise distribution of HbA1c level.
| Age | No. of patients and percentage within age | fasting blood sugar | Total | |
| <126 mg/dl | >126mg/dl | |||
| <40 | Count % within age | 7 63.60% | 4 36.4% | 11 100.0% |
| >40 | Count % within age | 22 34.40% | 42 65.6% | 64 100.0% |
| Total | Count % within age | 29 38.70% | 46 61.3% | 75 100.0% |
Pearson correlation between fasting blood sugar and HbA1c was found to be (r= 0.683), which indicates the strong and positive correlations and the P value for these variables was (P<0.01 i.e. 0.000000000153), which was significant.
DISCUSSION
This study showed in male that 49.0 % [24] male have fasting blood sugar <126 mg/dl, 51.0% [25] have fasting blood sugar >126 mg/dl. Similarly the HbA1c was found to be 46.9% [23] had HbA1c < 6.3%, 53.1% [26] had HbA1c >6.3%. In female, the study showed that 34.6% [9] had fasting blood sugar <126 mg/dl, 65.4% [17] had fasting blood sugar > 126 mg/dl. Similarly HbA1c was found to be 23.1% [6] had HbA1c <6.3% and 76.9% [20] had HbA1c >6.3%. There was significant correlation between HbA1c and fasting blood glucose (r = 0.683) (P<0.01 i.e. 0.000000000153). This was similar to study done by Sacks 2007[21]. And the study done by Dailey 2009 [22] also showed that A1C levels are strongly correlated with mean plasma glucose levels [22]. Similarly, the study performed by Clark et al. 2001 showed that there was a positive correlation between HbA1c and fasting blood glucose [23]. A diagnostic approach using FBG and HbA1c measurements very similar to those described in our study was recently proposed by Davidson et al. 1999 [24]. Their suggestion, in contrast to Davidson et al. is to use an HbA1c value of 7.1% (or 1% above the upper limit of normal) as the diagnostic threshold for diabetes. The choice of this HbA1c value was based on current treatment goals and was not for diagnostic purposes. This approach increases the specificity rather than the sensitivity of diagnosis. Because the mean ± 2 SDs value for any test is, by convention, a definable normal range, any level that is above the normal range in any given assay should be considered abnormal. Little et al. 1988, suggested that an HbA1c value >2 SDs above the mean was highly specific for diabetes [25]. Wiener and Roberts 1988, suggested that an HbA1c value >6.2% had 100% specificity for the diagnosis of diabetes [26]. Recent evaluation of data from the Third National Health and Nutrition Examination Survey has also indicated that HbA1c measurements are highly specific (>97%) for the diagnosis of diabetes [24]. Thus, patients with elevated HbA1c values even those in whom the FBG measurements are non diagnostic are overwhelmingly likely to have diabetes. It has been shown that A1C levels are strongly correlated with mean plasma glucose levels [14]. FPG levels are physiologically determined by the rate of hepatic glucose production, which is a function of the rate of insulin production, hepatic sensitivity to insulin levels, and free fatty acid concentrations [27-28].
CONCLUSION
There was significant correlation between HbA1c and fasting blood glucose. Our study demonstrates that, although the HbA1c test was marginally more specific but less sensitive than the FBG test, at the given cutoff points the accuracies of two tests were equivalent.
LIMITATIONS
Co-morbidities contribute greatly to the health-related quality of life in adults with diabetes. Our study did not explore the relative associations of multiple co-morbidities and poor glycemic control to the relationship between diabetes and disability.
ACKNOWLEDGEMENT
We would like to thank the management of Dhulikhel Hospital and Nobel College for providing the necessary guidelines and facilities to conduct this study. We are thankful to Nobel College for providing all the necessary funding for obtaining the required reagents and chemicals to carry out this study.
DISCLOSURES
The authors declare no potential/perceived conflicts of interest in the study.
REFERENCES
- World health organization. Definition, Diagnosis and Classification of Diabetes Mellitus and its Complications. Report of a WHO Consultation. Geneva: WHO/NCD/ NCS/99.2.
- Kasper DL et al (editors). (2005). Harrison's Principle of internal medicine, 16thed. McGraw-Hill.
- Adeghate E, Schattner P and Dunn E. (2006). An update on the etiology and epidemiology of diabetes mellitus. Ann N Y Acad Sci. 1084: 1-29.
- Reinauer H, Home PD, Kanagasabapathy AS and Heuck C. (2003). Laboratory diagnosis and monitoring of diabetes mellitus. World Health organization.
- American Diabetes Association. (2005). Standards of medical care in diabetes. diabetes care. 28(1): S4-S36.
- Kilpatrick ES, Rigby AS and Atkin SL. (2007). Variability in the relationship between mean plasma glucose and HbA1c: implications for the assessment of glycemic control. Clin Chem. 53(5): 897-901.
- Nathan DM, Kuenen J, Borg R, Zheng H, et al. (2008). Translating the A1C assay into estimated average glucose values. Diabetes Care. 31(8): 1473-1478.
- Derakhshan A, Akhavan M and Karamifar H. (2001). Evaluation of microalbuminuria 4 to 6 years following type 1 diabetes in children. Iran J Pediatr. 17(3): 252-256.
- Ginde AA, Cagliero E, Nathan DM and Camargo CA Jr. (2008). Value of risk stratification to increase the predictive validity of HbA1c in screening for undiagnosed diabetes in the US population. J Gen Intern Med. 23(9): 1346- 1353.
- Saudek CD, Herman WH, Sacks DB, Bergenstal RM, et al. (2008). A new look at screening and diagnosing diabetes mellitus. J Clin Endocrinol Metab. 93(7): 2447-2453.
- Gomyo M, Sakane N, Kamae I, Sato S, et al. (2004). Effects of sex, age and BMI on screening tests for impaired glucose tolerance. Diabetes Res Clin Pract. 64(2): 129-136.
- Anonymous. (2008). The diabetes control and complications trial and follow-up study. U.S. Department of Health and Human Services.
- American Diabetes Association. (2002). Implications of the United Kingdom prospective Diabetes Study. Diabetes Care. 25(1): S28-S32.
- Burtis C, Ashwood E and Bruns D. (2012). TIETZ- Textbook of clinical chemistry and molecular Diagnostics. Elsevier, St. Louis, USA.
- Inoue K, Matsumoto M and Kobayashi Y. (2007). The combination of fasting plasma glucose and glycosylated hemoglobin predicts type 2 diabetes in Japanese workers. Diabetes Res Clin Pract. 77(3): 451-458.
- Brennan AL, Gyi KM, Wood DM, Hodson ME, et al. (2006). Relationship between glycosylated hemoglobin and mean plasma glucose concentration in cystic fibrosis. J Cyst Fibros. 5(1): 27-31.
- Vaghari G, Azari G, Marjani A and Kordjazi M. (2005). Investigation of parameters related to diabetes mellitus in diabetics in Gorgan. Journal of Sabzevar Medical University. (4): 40-44.
- Farahani H and Naeemi A. (2004). A comparison between HbA1c and GTT in diagnostic of diabetes in people with disturbed FBS test. The scientific Journal of Arak Medical University.
- Oset mellaty A, Sharifi F and Amir Aghdami H. (1998). Determination of normal range for HbA1c in non diabetics in Zanjan. The Scientific Journal of Zanjan Medical University. (22): 11-19.
- Sacks D. (2007). Correlation between Hemoglobin A1c (HbA1c) and Average Blood Glucose: Can HbA1c Be Reported as Estimated Blood Glucose Concentration. Journal of Diabetes Science and Technology. 1(6): 801-803.
- Dailey G E. (2006). Contributions of Fasting and Postprandial Plasma Glucose Levels to Glycosylated Hemoglobin and Diabetes Mellitus–Related Complications: Treating Hyperglycemia with Insulin. 9: 149-150.
- Perry RC, Shankar RR, Fineberg N, Mc Gill J, et al. (2001). HbA1c Measurement Improves the Detection of Type 2 Diabetes in High-Risk Individuals With Nondiagnostic Levels of Fasting Plasma Glucose. Diabetes Care. 24(3): 465-471.
- Davidson MB, Schriger DL, Peters AL and Lorber B. (1999). Relationship between fasting plasma glucose and glycosylated hemoglobin: potential for false-positive diagnoses of type 2 diabetes using new diagnostic criteria, JAMA. 281(13): 1203-1210.
- Little RR, England JD, Wiedmeyer HM, McKenzie EM, et al. (1988). Relationship of glycosylated hemoglobin to oral glucose tolerance: implications for diabetes screening. Diabetes. 37(1): 60-64.
- Wiener K and Roberts NB. (1998). The relative merits of haemoglobin A1c and fasting plasma glucose as first-line diagnostic tests for diabetes mellitus in non-pregnant subjects. Diabet Med. 15(7): 558 -563.
- Riddle MC. (1990). Evening insulin strategy. Diabetes Care. 13(6): 676-686.
- Deedwania PC and Fonseca VA. (2005). Diabetes, prediabetes, and cardiovascular risk: shifting the paradigm. Am J Med. 118(9): 939-947.
- ADA. (2009). International Expert Committee Report on the Role of the A1C Assay in the Diagnosis of Diabetes, Diabetes Care. 32(7): 1327-1334.