Previous Issues Volume 1, Issue 1 - 2016
The Relationship of Provider Gender to Patient Satisfaction in the Emergency Setting: A Survey Approach and a Call for Future Mixed Quantitative-Qualitative Approaches
Kirsten Green1, Julianne Wysocki2, James Espinosa3, Victor Scali4
1Department of Emergency Medicine, Overlook Hospital, Summit, NJ, USA.
2Department of Emergency Medicine, Bayhealth Emergency Department, Dover, DE, USA.
3Department of Emergency Medicine, Rowan University SOM Kennedy University Hospital, Stratford, NJ, USA.
4Program Co-Director, Emergency Medicine Residency, Rowan University SOM
Corresponding Author: James Espinosa, Department of Emergency Medicine, Rowan University SOM Kennedy University Hospital, 18 East Laurel Road, Stratford, NJ 08084, USA, Tel: +1 646 241 5695; E-Mail: [email protected]
Received Date: 25 Feb 2016 Accepted Date: 11 Mar 2016 Published Date: 16 Mar 2016
Copyright © 2016 Espinosa J
Citation: Green K, Wysocki J, Espinosa J and Scali V. (2016). The Relationship of Provider Gender to Patient Satisfaction in the Emergency Setting: A Survey Approach and a Call for Future Mixed Quantitative-Qualitative Approaches. Mathews J Emergency Med. 1(1): 002
ABSTRACT
Patient satisfaction continues to be an ongoing area of research, marketing, and quality improvement interest for hospitals, patients, and clinicians alike. Patient satisfaction has been identified as an outcome of care, and has been included in outcome research models. The objective of this study was too look at the relationship of physician gender with patient satisfaction in the emergency department setting using survey methodology and secondarily to look at the relationship between patient gender and ED physician gender preference. The results show that in all four of the directly measured metrics, patients rated the care as provided by female physicians higher than that provided by male physicians. In fact, in one metric, satisfaction with the care that was provided, the result was statistically significant, as evidenced by both parametric (p < .01) and two non-parametric (p = .01 to p = .02) assessments. The gender of patients did not appear to explain the results seen. The data suggest that there is a relationship between provider physician gender and patient satisfaction, in the direction of a positive relationship between female provider physician gender and directly measured patient satisfaction. Further research, perhaps with a mixed qualitative-quantitative methodology, may serve to elucidate the nature of the underlying reasons for this relationship. KEYWORDS
Patient Satisfaction; Emergency Department (ED) Patient Satisfaction; Provider Gender and Patient Satisfaction; Provider Gender and Emergency Department Patient Satisfaction; Gender and Patient Satisfaction.
INTRODUCTION
Patient satisfaction continues to be an ongoing area of research, marketing, and quality improvement interest for hospitals, patients, and clinicians alike. Patient satisfaction has been identified as an outcome of care, and has been included in outcome research models. As an example, such researchers as Eugene Nelson have defined the importance of patient satisfaction by placing it in his clinical value compass model on equal footing with such outcomes as clinical, cost, and, quality of life in the measurement of overall value in health care [1].
To date, there has been little research looking at patient satisfaction in the emergency setting in relation to physician gender. Most commonly used tools for the purpose of measuring patient satisfaction do not routinely code data regarding the gender of the physician. Previous research has shown that men and women differ in their approaches to patient care especially in regards to communication styles [2,3]. This may influence patient satisfaction [4].
By better measurement of predictive factors relating to patient satisfaction, we hope to be able to propose further changes to improve quality in the emergency care setting.
The purpose of this pilot survey study is to determine the relationship of patient satisfaction with provider gender and its possible effect on the relationship to current patient satisfaction metrics. In addition, some questions are designed to elicit, in an open-ended comment approach, patient preference concerning ED physician gender preference.
MATERIAL AND METHODS
Research Design and Methods
The study design was a convenience sample of emergency patients during their ED visit, using a predetermined set of questions. Participants were approached in the emergency department during their stay in the emergency department. Subjects were provided with a copy of the abstract and consent form. All participants were given a consent form to sign prior to distribution of the survey.The study was explained to the potential subjects by either of the lead investigators. The consent was read by the patients and any questions about the study were answered. If she/he agreed to enroll, the subject signed the consent form. The study staff obtaining consent signed and dated the consent form and a copy was given to the subject. There was no cost or compensation for the subjects participation. Medical records were not accessed in the course of the study. Metric-based satisfaction-related questions were based on a five part Likert scale. Results were analyzed principally with the Minitab-16 software program. [minitab.com, State College, PA].
OBJECTIVES
1. Primarily to study the relationship of physician gender with patient satisfaction in the emergency department setting using survey methodology. 2. Secondarily to determine the relationship between patient gender and ED physician gender preference.
Inclusion Criteria:Emergency department patients, nonpregnant, above the age of 18.
Exclusion Criteria:Pregnant patients, patients below the age of 18, and patients unable to understand the study or provide informed consent (e.g. dementia).
The data collected included
- Patient age
- Patient gender
- Provider gender
- Metric: Your satisfaction with the care that was provided
- Metric: Concern the care provider showed for your questions or worries
- Metric: Your confidence in this care provider
- Metric: Likelihood of your recommending this care provider to others
- Overall Satisfaction Score [Note: 4 Metric Average: Calcu lated based on 4 metrics]
- Was your physician a male or female? (Provider gender)
- Do you feel the gender of the treating physician positively affected your satisfaction with your treatment?
- Did you have a preference, male or female physician?
- [If preference] Would rather be treated by a female or male physician?
- Comments: If you had your choice would be treated by a female or male physician?
RESULTS
Number of Participants and Age:There were 30 participants in the study. The mean age was 52.7 years of age. The youngest patient was 21 years of age and the oldest patient was 87 years of age. The median age was 53. A histogram of patient age shows distribution of ages across the intended study range. The distribution was normal, as evidenced by the Anderson-Darling Normality test (Figure 1).
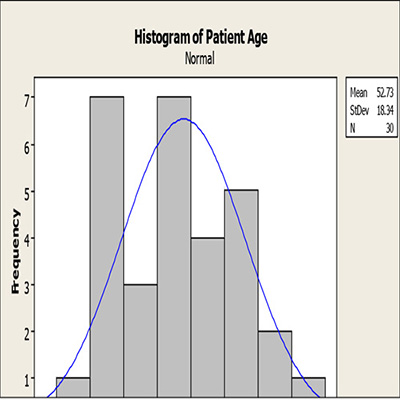
Figure 1: Histogram of patient age.
Patient Gender: 15 of the respondents were female (50%) and 15 of the respondents were male (50%) The mean age of females was 56.6. [StDev 21.3] The mean age of males was 48.8. [StDev 14.5]. Both the female and male distributions by ages were normal based on the Anderson-Darlington Normality Test (Figure 2).
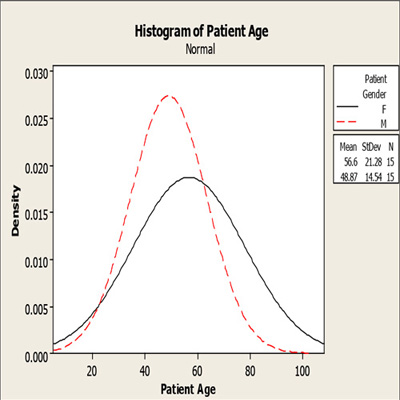
Figure 2: Age distributions by gender. Histogram display.
Your satisfaction with the care that was provided:This metric showed a mean score of 4.6, with a standard deviation of 0.49. [95% CI 4.45, 4.81].
Relationship of Gender and Satisfaction with the care that was provided:Patients rated their patient satisfaction with care provided by a female physician [mean 4.82] as higher than that provide by a male physician [mean 4.37]. This relationship was also seen in the non-parametric analysis. Patients rated their median patient satisfaction by a female physician [median 5.0] as higher than that provide by a male physician [median 4.0]. The mean difference was statistically different. [T test, unpaired mean, p = .007]. The median difference was also statistically different [Moods Median p = .01, Kruskal-Wallis p = .015](Figure 3).
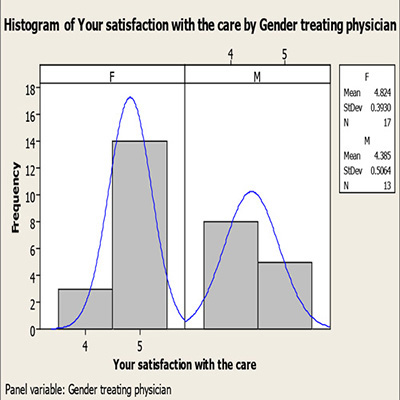
Figure 3: Satisfaction with Care Provided by Gender Treating Physician.
Concern the care provider showed for your questions or worries:This metric showed a mean score of 4.7, with a standard deviation of 0.46. [95% CI 4.52, 4.87] The median was 5.0.
Relationship of Gender and Concern the care provider showed for your questions or worries:Patients rated the concern the care provider showed for your questions or worries, in reference to care provided by a female physician [mean 4.76] as higher than that provide by a male physician [mean 4.61]. This relationship was also seen in the nonparametric analysis.Patients rated their median patient satisfaction by a female physician [median 5.0] as the same as that that provided by a male physician [median 5.0]. The mean difference was not statistically different. [T test, unpaired mean, p = .82] The median difference was not statistically different [Moods Median p = .37, Kruskal-Wallis p = .38] (Figure 4).
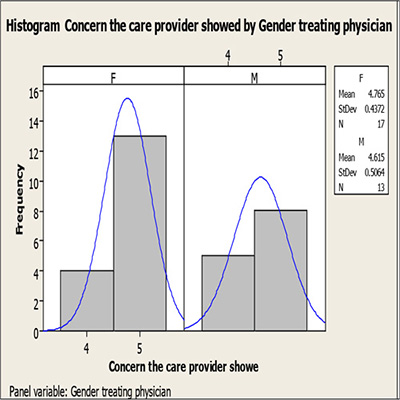
Figure 4: Summary Concern the care provider showed for your questions or worries, by Gender Treating Physician
Your confidence in this care provider:This metric showed a mean score of 4.63, with a standard deviation of 0.49. [95% CI 4.45, 4.82] The median was 5.0.
Relationship of Gender and Your confidence in this care provider:Patients rated their confidence in the care provided by a female physician [mean 4.77] as higher than that provide by a male physician [mean 4.46]. This relationship was also seen in the non-parametric analysis.Patients rated their median patient satisfaction by a female physician [median 5.0] as higher than that that provided by a male physician [median 4.0]. The mean difference was not statistically different. [T test, unpaired mean, p = .64] The median difference was not statistically different [Moods Median p = .08, Kruskal-Wallis p = .09](Figure 5).
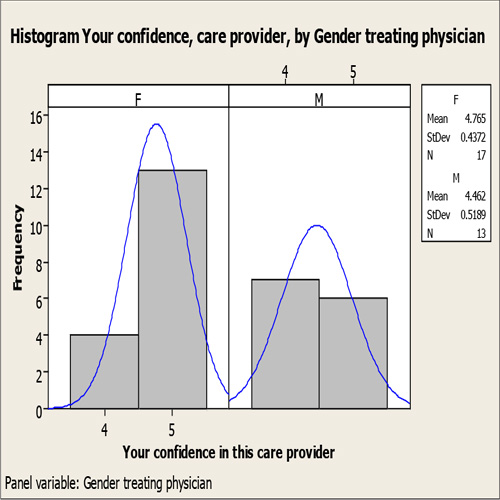
Figure 5: Summary: Your confidence in this care provider by physician gender.
Likelihood of your recommending this care provider to others:This metric showed a mean score of 4.7, with a standard deviation of 0.46. [95% CI 4.52, 4.87] The median was 5.0.
Relationship of Gender and Likelihood of your recommending this care provider to others:Patients rated likelihood of recommending this care, in reference to the care provided by a female physician [mean 4.70] as higher than that provide by a male physician [mean 4.69] Patients rated their median patient satisfaction by a female physician [median 5.0] as the same as that that provided by a male physician [median 5.0]. The mean difference was not statistically different. [T test, unpaired mean, p = .84] The median difference was not statistically different [Moods Median p = .8, Kruskal-Wallis p = .93](Figure 6).
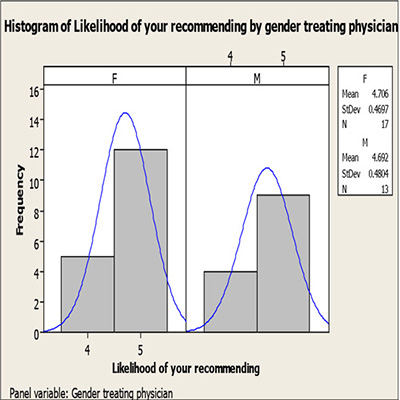
Figure 6: Summary Likelihood of your recommending this care provider to others by gender.
Overall 4 Metric Average Score [4 Metric Average: Calculated based on 4 metrics]:This metric showed a mean score of 4.67, with a standard deviation of 0.40 [95% CI 4.5, 1].
Relationship of Physician Gender and Overall Satisfaction Score [4 Metric Average: Calculated based on 4 metrics]:Patients rated their patient satisfaction by a female physician [mean 4.76] as higher than that provide by a male physician [mean 4.53] This relationship was also seen in the nonparametric analysis.Patients rated their median patient satisfaction by a female physician [median 5.0] as higher than that provide by a male physician [median 4.76]The mean difference was not statistically different. [T test, unpaired mean, p = .12]The median difference was not statistically different [Moods Median p = .15, Kruskal-Wallis p = .16.
Relationship of patient gender to overall patient satisfaction:The mean for overall satisfaction when analyzed by patient gender was essentially identical. (4.64 females, 4.65 males), with almost identical standard deviations (.42 males, .41 females) There was no statistical difference between these two groups. T-test, unpaired means, p = .84). The medians reflect a slightly higher median satisfaction for male patients (female patient 4.75, male patients 5.0). The medians were not statistically significant (Mann-Whitney Test p = .68, Moods Median Test p = .19).
Physician gender:There were 13 female physician providers [43.3%] and 17 male physician providers [56.7] in the 30 total patients studied. The two percentages were not statistically significant, as determined by the Sign and Binomial test. [p-.58]. The two groups were not statistically different as determined by the Chi-Squared test [p = 0.46] (Figure 7).
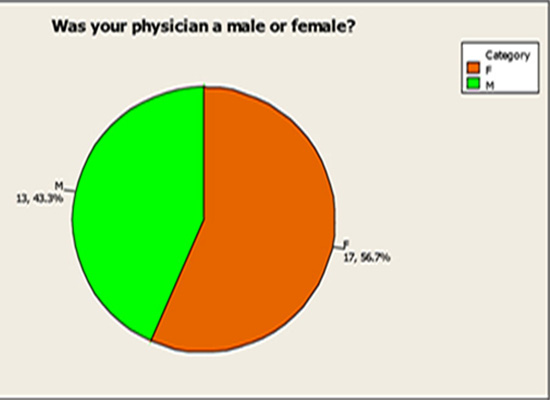
Figure 7: Pie Chart. Gender of Physician.
Do you feel the gender of the treating physician positively affected your satisfaction with your treatment?21 patients stated that the gender of the treating physician positively affected their satisfaction with treatment. (70%) 9 patients stated that the gender of the treating physician did not positively affect their satisfaction with their treatment. (30%). The responses were statistically significant, as determined by the Sign and Binomial Test. The one-tail P value is 0.02. The two groups were also statistically different as determined by the Chi-Squared test [p = 0. 02] (Figure 8).
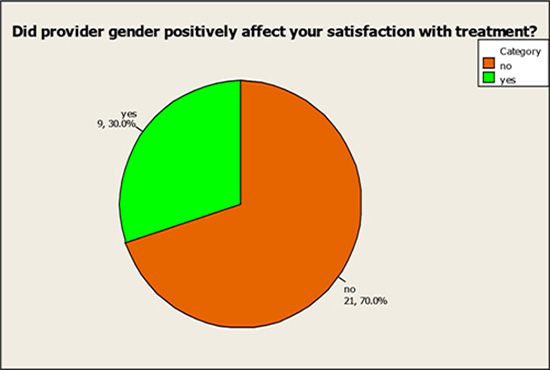
Figure 8: Pie Chart. Did provider gender positively affect your satisfaction with treatment?
Did you have a preference, female or male physician?14 patients expressed a preference (47%). 16 patients expressed no preference (53%). These two groups were not significantly different as determined by the Sign and Binomial test [p = .71] as well as by the Chi-Squared Test [p = .85] (Figure 9).
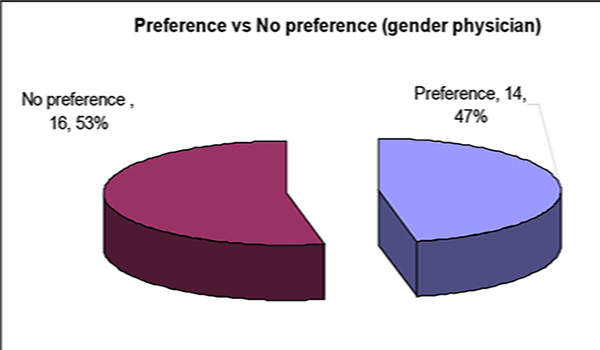
Figure 9: Preference v No preference (in regards to gender physician).
[If preference] Would you rather be treated by a female or male physician?As noted above, 14 patients expressed a preference of a female or male physician. 8 patients preferred a female physician (57%), 6 patients preferred a male physician (43%). This difference was not statistically different, as determined by the Sign and Binomial Test [p =.79] or by the Chi-Squared Test [p = .59] (Figure 10).
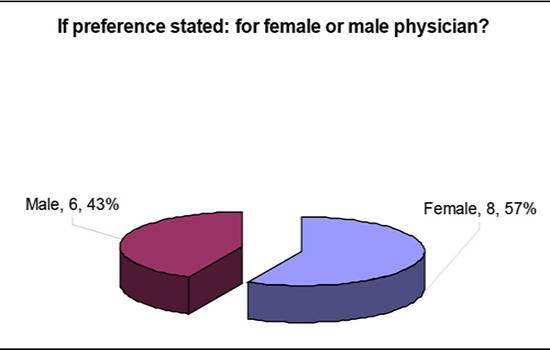
Figure 10: If preference stated, for female or male physician?
Comments section of results: If you had your choice would you be treated by a female or male physician?Three of four comments specifically related to physician gender preference were made in reference to a preference for a female physician.
- "Being female myself I feel they understand females better"
- "I think she could relate to some of my problems more because she is a female"
- "They tell no lie" One of four comments specifically related to physician gender preference was made in reference to a preference for a male physician.
- "More comfortable speaking to somebody of the same gender" A column diagram (Figure 11) with an associated table of metrics (Table 1 and 2) summarizes the metric results by
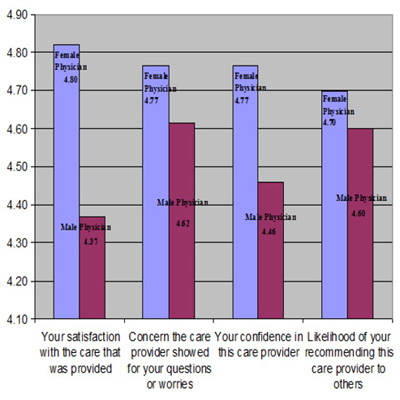
Figure 11: Column Diagram, 4 directly measured metrics, by gender physician.
Table 1: 4 Metrics and Average of Metrics, by Gender of Physician.
| Female Physician | Male Physician | p-value difference | |||||
|---|---|---|---|---|---|---|---|
| Mean | StDev | N | Mean | StDev | N | ||
| Your satisfaction with the care that was provided | 4.82 | 0.393 | 17 | 4.37 | 0.506 | 13 | p=.007 |
| Concern the care provider showed for your questions or worries | 4.77 | 0.437 | 17 | 4.46 | 0.506 | 13 | p=.82 |
| Your confidence in this care provider | 4.77 | 0.437 | 17 | 4.46 | 0.519 | 13 | p=.6 |
| Likelihood of your recommending this care provider to others | 4.70 | 0.47 | 17 | 4.60 | 0.48 | 13 | p=.84 |
| Overall Satisfaction Score (4 Metric Average) | 4.76 | 0.39 | 17 | 4.53 | 0.406 | 13 | p=.12 |
DISCUSSIONS
The overall intent of this study was to look at the relationship of gender to patient satisfaction, in an emergency department setting using a quantitative (survey) methodology, with some qualitative (open-ended) commentaries by patients.
Table 2: Non-parametric test output in relation to satisfaction metric by gender.
| Female Physician | Male Physician | (Mood�s Median Test) | Kruskal-Wallis | |||
|---|---|---|---|---|---|---|
| Median | N | Median | N | p-value | p-value | |
| Your satisfaction with the care that was provided | 5.00 | 17 | 4.00 | 13 | p = .01 | p = .015 |
| Concern the care provider showed for your questions or worries | 5.00 | 17 | 5.00 | 13 | p = .37 | p = .38 |
| Your confidence in this care provider | 5.00 | 17 | 4.00 | 13 | p = .08 | p = .09 |
| Likelihood of your recommending this care provider to others | 5.00 | 17 | 4.00 | 13 | p = .09 | p = .093 |
| Overall Satisfaction Score (4 Metric Average) | 5.00 | 17 | 4.00 | 13 | p = .015 | p = .015 |
The Mood's Median Test and the Kruskal-Wallis Test were used. Note that satisfaction with the care provided, by gender, was statistically significant by both tests, in the direction of higher patient satisfaction with female physicians. [Moods Median p = .01, Kruskal-Wallis p = .015].
The results show that in all four of the directly measured metrics, patients rated the care as provided by female physicians higher than that provided by male physicians. In fact, in one metric, satisfaction with the care that was provided, the result was statistically significant, as evidence by both parametric (p < .01) and two non-parametric (p = .01 to p = .02) assessments.
It is interesting to note that confidence with the care provider by gender tended toward but does not meet statistical significance, in non-parametric tests, in the direction of a positive relationship with female gender physician provider. This subtle relationship could be elucidated in further studies. It seems to be congruent with the study by Mast et al in terms of increased satisfaction with the dyad of female providerfemale patient [2]. This may also be particularly relevant in the case of emergency department patients who are generally meeting the particular physician for the first time. Hall et al. demonstrated an increased level of satisfaction with female providers when physicians and patients were meeting for the first time [4].
Patients felt that the gender of their treating physician did affect their satisfaction. This finding, independent of the actual measured metric of the degree of that satisfaction, was particularly significant. Most patients (53%) stated that they did not essentially have a priori preference of physician when asked "would you rather be treated by a female or male physician." However, of those who provided a preference, female physicians were preferred (57%). This difference was not statistically significant.
The gender of patients did not appear to explain the results seen. The mean for overall satisfaction (an average of the metrics) by patient gender was essentially identical.
The gender of the physicians providing care in the study, as noted above, was not evenly distributed between female physicians (43%) and male physicians (57%). However, this distribution was not significantly significant, and it is therefore unlikely that it had an effect on the results.
However, it appears that several key findings suggest a positive relationship of female physician gender to patient satisfaction.
Although limited in number, the subjective comments of two female patients suggest specifically that female physicians had a better understanding and a better capacity to relate to the problems of female patients. One patient reflected that female physicians "tell no lie." The meaning of this latter comment is unclear, and may reflect a personal bias not shared by the general population. The meaning of all of the subjective comments would appear to benefit from further clarification and the circumstances that helped form their opinion. In a meta-analysis of physician gender effects on medical communication, Roter found that in patient interactions, although information communicated was similar, female physicians generally employed a more patient-centered approach; this in turn was felt to possibly foster a more reciprocal patient-provider interaction and thus positively influence the provider-patient relationship. This may explain the higher level of satisfaction with female providers found in our results [3].
There were several limitations to this study. Although the physician surveyors were both female and the results were provided by the patients without any conscious influence of the physician surveyors, the potential for acquiescence bias exists in this type of study design. The sample size was relatively small even though the distribution by age and patient gender, as well as by physician gender, was remarkably even. A larger study may have shown statistical significance for the remaining metrics.
Future studies may benefit from a more mixed quantitativequalitative design. In 2009, Creswell, an expert on research design, noted that such a "mixed methods research, employing the combination of quantitative and qualitative approaches... utilize[s] the strength of both." By utilizing his "concurrent triangulation" approach, one could compare quantitative and qualitative data to determine if there are "convergences, differences, or some combination," allowing for an integrative and iterative approach to the data [5].
In this study, there appears to be convergence around the finding of a relationship, in the direction of a positive relationship to patient satisfaction, between female physician gender and patient satisfaction metrics. However, the nature of the reasons for this relationship might be better ascertained with a mixed-methods approach. Although infrequently used in healthcare research this methodical approach could allow patients to express their underlying thinking and feeling. These themes could be developed for further study.
CONCLUSION
The data suggest that there is a relationship between provider physician gender and patient satisfaction, in the direction of a positive relationship between female provider physician gender and directly measured patient satisfaction. Further research, perhaps with a mixed qualitative-quantitative methodology, may serve to elucidate the nature of the underlying reasons for this relationship.
REFERENCES
- Nelson EC and Batalden PB. (2011). Value by Design. 2nd ed. Jossey-bass, San Francisco, California.
- Mast MS, Hall JA and Roter DL. (2007). Disentangling physician sex and physician communication style: their effects on patient satisfaction in a virtual medical visit. Patient Educ Couns. 68(1), 16-22.
- Roter DL, Hall JA and Aoki Y. (2002). Physician Gender Effects in Medical Communication: A meta-analytic Review. JAMA. 288(6), 756-764.
- Hall JA, Blanch-Hartigan D and Roter DL. (2011). Patients' Satisfaction with male versus female physicians: a meta-analysis. Med Care. 49(7), 611-617.
- Creswell JW. (2009). Research design: qualitative, quantitative, and mixed methods approaches. (3rd ed.). Thousand Oaks, California: SAGE Publications.