Previous Issues Volume 2, Issue 1 - 2017
Herding CATS: ED CT Utilization Pilot Study: Provider Factors
Henry Schuitema, James Espinosa*, Alan Lucerna
Department of Emergency Medicine, Rowan University SOM Kennedy University Hospital, Stratford, NJ, USA. Corresponding Author: James Espinosa, Department of Emergency Medicine, Rowan University SOM Kennedy University Hospital, 18 East Laurel Road, Stratford, NJ 08084, USA, Tel: +1 646 241 5695; E-Mail: [email protected] Received Date: 11 Apr 2017 Accepted Date: 17 Apr 2017 Published Date: 21 Apr 2017 Copyright © 2017 Espinosa J Citation: Schuitema H, Espinosa J and Lucerna A. (2017). Herding CATS: ED CT Utilization Pilot Study: Provider Factors. M J E-Med. 2(1): 023. ABSTRACT
There is a growing world-wide literature concerning the increased use of computerized tomography (CT) scan examinations in the emergency department setting. The reasons for the increased rates seen have been predominantly attributed to the role of CT in providing rapid and accurate diagnostic imaging. [Oh] As Chang et al point out, “CT is a useful diagnostic tool for the differential of many acute conditions, rendering it an ideal and integral diagnostic tool in the ED setting.” [Chang] Other driving forces to CT utilization have been discussed in the literature. “Factors cited for this trend include a need for rapid, accurate diagnosis, a general trend towards less invasive testing, and increasing concern about malpractice litigation and an increasing public awareness of, and often desire for, CT scanning capabilities.” [Lee] On the other hand, “CT becomes a source of concern to the medical community from the perspective of increased cost and radiation dose to the patient population.” [Oh] This has led to studies of CT utilization. Research has included a number of provider related factors, including provider experience and gender. The purpose of this study was to look at the relationship of overall CT utilization, defined as the number of studies per 100 patients, by provider experience, gender and directorship experience. KEYWORDS
CT Utilization Rates in Emergency Medicine; Emergency Department CT Utilization Rates; Provider Experience and CT Utilization in Emergency Medicine. INTRODUCTION
Here we present the results of an study of ED CT utilization looking at provider factors. The purpose of this study was to look at the relationship of Attending emergency physician experience, gender, and department director experience to the percent overall utilization of CT scans. MATERIALS AND METHODS
The purpose of this study was to look at the relationship of attending emergency physician experience, gender, and department director experience to the percent overall utilization of CT scans. The data was part of ongoing administrative and management work of the department of emergency medicine. The data collected was from a six month period, from January 1, 2016 to June 30, 2016, comprising approximately 74,000 patient visits. CT scan percent utilization was defined as the total number of ED CT scans ordered per 100 patient visits. Department director experience was defined as current or previous department directorship experience. Associate director experience was not considered in this calculation. Objective 1: To look at the relationship of attending experience, defined as years of full time practice in emergency medicine, to CT scan utilization. Objective 2: To look at the gender of the attending emergency physician in relation to CT scan utilization. Objective 3: To look at the relationship of ED director experience, defined as current or previous department directorship in compari son to attendings who are not and have not previously been ED directors, in relation to CT scan utilization. Data was obtained in the course of ongoing quality management activities. RESULTS
Overall CT Utilization Rate There were 30 attending emergency physicians in the cohort. Data was coded after entry into the database. The overall CT utilization was 31.8%, with a minimum of 17% and a maximum of 52% [95% CI 28.9-34 %]. The range was 35%. The median (31.5%) was almost identical to the mean, suggesting a normal distribution of the data [Table 1]. This was confirmed with the Anderson-Darling statistic. The standard deviation was 7.62 and the variance was 58.12%. There was a 205% difference between the utilization rates of the highest and the lowest provider [Figure 2]. Table 1: Descriptive statistics, CT utilization.
|
Descriptive Statistics: Percent CT Utilization |
|||
|---|---|---|---|
|
Variable |
Mean |
StDev |
Variance |
|
Percent CT Utilization |
31.77 |
7.62 |
58.12 |
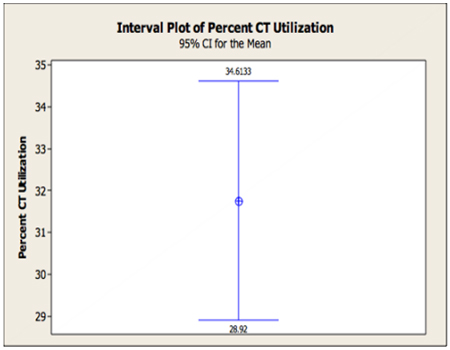
Figure 1:95% confidence interval for the mean, CT utilization.
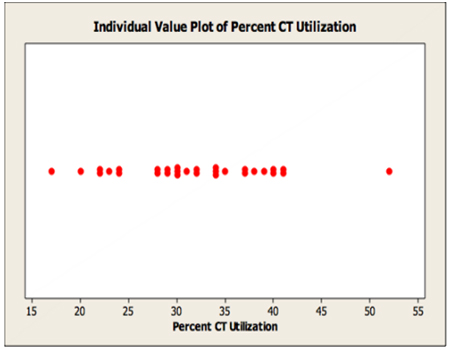
Figure 2: Individual value plot, CT utilization
Overall CT Utilization Rate The average years of ED experience was 11.4 (median 9.5), with a minimum of one year and a maximum of 36 years. The range was 35 years. The mean CT utilization for below mean years of experience, defined as < 11 years of experience, was 32.8%. The percent CT utilization for 12 or greater years of experience was 30.73%. Although the mean utilization was lower in the greater experience group, the difference was not
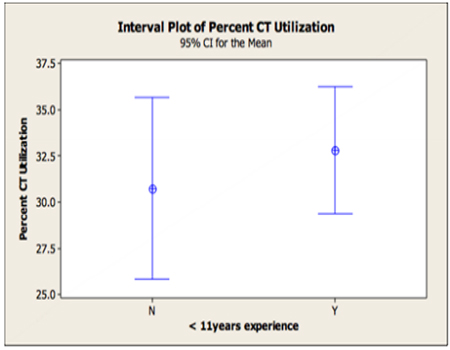
Figure 3: Interval plot CT utilization with 95% CI for the mean
A regression analysis of the percent CT utilization versus years of ED experience also demonstrated that there was no statistically significant relationship. ED experience accounted for only 12.6% of the variance [Figure 4].
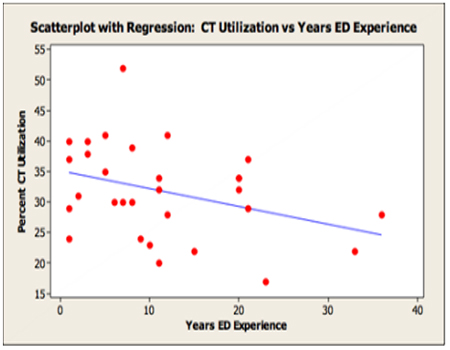
Figure 4: Scatterplot with regression, CT utilization vs years’ experience
CT Utilization and Gender CT utilization was essentially identical by gender (31.8%). (p=0.994).
CT Utilization and ED Director Experience The cohort with current or previous ED director experience has a CT utilization rate of 20.35%. The non-ED-director experience cohort had a mean CT utilization rate of 33.5% [Figure 5]. The difference was very strongly statistically significant. [Two-sample T-test and CI: P-value less than 0.001 KruskalWallis P=001] This difference was not explained by years of ED experience [P=0.13].
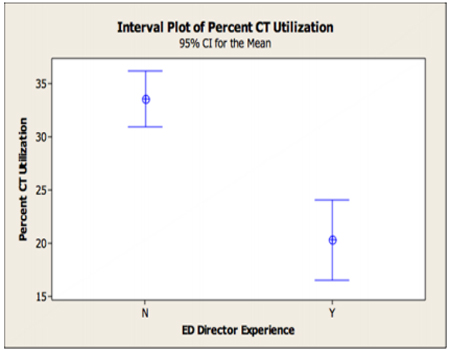
Figure 5: Interval plot ED director experience vs. CT utilization
Overall CT Utilization Rate There were 30 attending emergency physicians in the cohort. Although this is relatively small sample size, the data showed a normal distribution. The overall CT utilization was 31.8%, with a minimum of 17% and a maximum of 52%. The range was 35%. The median (31.5%) was almost identical to the mean, suggesting a normal distribution of the data. The data thus may serve as a baseline study. Our data show a 205% difference between the utilization rate of the highest percent provider and the lowest percent provider. The variance was over 58%. Performance benchmarks for comparative EDs is remarkably difficult to obtain. Published data is often several years out of date in the context of increasing CT utilization rates nationally (and internationally). One available online benchmark [Sheridan, Radisphere http://sheridanhealthcare. com] also found high variance and high inter-provider differences. The median utilization (31.5%) in this study falls within the range of 20% to 40% noted in the benchmark study by the Sheridan, (Radisphere). The national median use in that study was concluded to be 28.5%, which is similar to the median percent utilization found in this data set [1-4].
The study noted that the problem is not simple. “This may seem like a simple problem to solve, but our research has found that the root causes of ED radiology overutilization are actually fairly nuanced. “Rates for individual ED physicians at the same hospital often ranged from 10 percent to 50 percent.” [http://sheridanhealthcare.com/news-events/ blog/ct-utilization-in-the-emergency-department improvingoutcomes-and-reducing#sthash.gkzGzedP.dpuf] The provider range seen in the Sheridan data is qualitatively similar to the range of 17% to 52% seen in our data.
The notion of the complexity of CT utilization is supported by Kirsch et al. In a multi-state study of 221 emergency departments in 41 states, with over 3 million ED patient visits, the authors found that utilization rates varied by a number of factors, including patient age, ED volume and disposition status of the patient. [Kirsch] The overall utilization rate was 16.7%. However, for admitted patients, the utilization rate was 27.8% [5].
Years of ED Experience The mean CT utilization for below mean years of experience, defined as < 11 years of experience, was 32.8%. The percent CT utilization for 12 or greater years of experience was 30.73%. Although the mean utilization was lower in the greater experience group, the difference was not statistically significant. (Pvalue=0.47). Similarly, a regression analysis showed a visual sense of a trend towards decreased CT utilization as a function of experience, but the relationship was not statistically significant. Our data are consistent with Chen et al’s study of CT angiography utilization, in which there was no correlation of rates with years of experience. (Chen) They point out that other studies have shown a correlation of physician experience and test ordering practice. Specifically, [6, 7] looking at practice patterns in a health claims database in Massachusetts. In that study, physicians with less than 10 years of experience ordered more studies and had higher costs. [7,8] Charlson found a higher test ordering rate in a resident cohort in comparison to an attending cohort in an out-patient study. It is not clear how applicable this would be to the ED setting.
CT Utilization and Gender In our data, CT utilization was essentially identical by gender (31.8%). (p=0.994).
Years of ED Experience A study of CT angiography use by Chen et also did not find a gender related difference in utilization rates by gender. They point out that “variable data is available on the relationship between physician gender and practice patterns, with some showing no consistent effect on test ordering and others demonstrating higher ordering rates by female physicians.” [Chen] However, Chen et al then cite a study by Ferrier et al [9] which showed that female physicians were more likely to follow practice guidelines than male physicians. Maserejian et al saw no effect of gender in an out-patient study of test ordering practice. [10]. A study by Sholer et al found an increased likelihood to order a test in study of pediatric patients with abdominal pain, evaluated in both in-patient and out-patient settings [11]. Rosen et al looked at imaging study utilization rates in an out-patient internal medicine setting and saw a statistically higher imaging ordering rate by female providers. However, they point out that the patient mix may have accounted for the difference seen. [Rosen] Thus, much of the data concerning gender and imaging utilization rates are not directly applicable to the ED setting-and the study by Chen did not show a gender based difference [12].
CT Utilization and ED Director Experience The cohort with current or previous ED director experience had a CT utilization rate of 20.35%. The non-ED-director experience cohort had a mean CT utilization rate of 33.5%.
The difference was very strongly statistically significant. [Twosample T-test and CI: P-value less than 0.001 Kruskal-Wallis P=001] This difference was not explained by years of ED experience. [P=0.13] This appears to be a new finding, and compa- rable data could not be found in a PubMed and online search. The reasons are unclear. The sample was small. Physicians with director experience may be more aware of the growing national and international utilization of CT scanning. They may be more aware of cost and radiation. It is possible that qualitative interviewing of physicians with director experience may elucidate management strategies that deploy decreased CT utilization.
Overall CT Utilization Rate The overall CT utilization was 31.8%, with a minimum of 17% and a maximum of 52%. The range was 35%. The data show a 205% difference between the utilization rate of the highest percent provider and the lowest percent provider. The variance was over 58%. One available online benchmark [Sheridan, Radisphere http:// sheridanhealthcare.com] also found high variance and high inter-provider differences. The median utilization (31.5%) in our study falls within the range of 20% to 40% noted in the benchmark study by Sheridan, Radisphere and is national median of 28.5% in their study. The provider range in the Sheridan study is qualitatively similar to the range of 17% to 52% seen in our data.
The average years of ED experience was 11.4 (median 9.5), with a minimum of one year and a maximum of 36 years. The range was 35 years. It is not known how this average compares with other emergency departments.
CT Utilization and Years ED Experience The mean CT utilization for below mean years of experience, defined as < 11 years of experience, was 32.8%. The percent CT utilization for 12 or greater years of experience was 30.73%. Although the mean utilization was lower in the greater experience group, the difference was not statistically significant. (p-value-0.47). Similarly, a regression analysis showed a visual sense of a trend towards decreased CT utilization as a function of experience, but the relationship was not statistically significant. Our data are consistent with Chen et al’s study of CT angiography utilization, in which there was no correlation of rates with years of experience [2].
CT Utilization and Gender In our data, CT utilization was essentially identical by gender (31.8%). (p=0.994)
This is similar to a study of CT angiography use by Chen et did not find a gender related difference in utilization rates by gender. Other ordering studies in relation to provider gender do not seem applicable to overall CT utilization. We were unable to find benchmark data on overall CT utilization by gender in an emergency department setting. Thus, there is no evidence in our data of a gender based difference in CT utilization in the ED.
CT Utilization and ED Director Experience The cohort with current or previous ED director experience has a CT utilization rate of 20.35%. The non-ED-director experience cohort had a mean CT utilization rate of 33.5%. The difference was very strongly statistically significant. [Two-sample T-test and CI: P-value less than 0.001 Kruskal-Wallis P=001] This difference was not explained by years of ED experience. [P=0.13] This appears to be a new finding, and comparable data could not be found in a PubMed and online search. The reasons are unclear, but are not explained by years of experience. The sample was small. Physicians with director experience may be more aware of the growing national and international utilization of CT scanning. They may be more aware of cost and radiation. It is possible that qualitative interviewing of physicians with director experience may elucidate management strategies that deploy decreased CT utilization.
The overall utilization data can serve as a pilot benchmark for internal improvement work. The finding of statistically significant utilization by physicians with ED director experience may serve as a trigger to a novel approach to understanding utilization decisions.