Information Links
Related Conferences
Previous Issues Volume 7, Issue 1 - 2023
Formulation and Evaluation of Nanoparticles Containing Antiviral Protease Inhibitor
Harish Joshi, Ragini Bundela, Sourabh Jain*, Karunakar Shukla
College of Pharmacy, Dr. A. P. J. Abdul Kalam University, Indore, Madhya Pradesh, India
*Corresponding Author: Dr. Sourabh Jain, College of Pharmacy, Dr. A. P. J. Abdul Kalam University, Indore, Madhya Pradesh, India; Tel: +91 94250 42457 Email: [email protected]
Received Date: 02 January 2023
Published Date: 03 February 2023
ABSTRACT
Atazanavir (ATV) is a HIV protease inhibitor. Due to its intense lipophilicity, the oral delivery of ATV encounters several problems such as poor aqueous solubility, pH-dependent dissolution, rapid first-pass metabolism in liver by CYP3A5, which result in low bioavailability. To overcome aforementioned limitations, ATV-loaded chitosin nanoparticles (ATV NPs) were prepared to enhance oral bioavailability. ATV NPs were prepared by nano precipitation method. In the present study Chitosan nanoparticles containing Atazanavir was prepared. The effect of increase in Chitosan concentration on various parameters like particle size, zeta potential and in vitro release profile were studied. The Atazanavir nanoparticles were formulated and evaluated for its in vitro drug release profile. Based on the drug content, entrapment efficiency, particle size, zeta potential and in vitro drug release profile of Atazanavir nanoparticles formulations formulation AZNP3 was selected as the best formulation in which the particle size was 227.9nm. The in vitro % drug release of AZNP3 formulation was 99.85% and it was found to be suitable formulation to manage the condition of HIV. Hence it can be concluded that the newly formulated controlled release nanoparticulate drug delivery systems of Atazanavir may be ideal and effective in the management of HIV by allowing the drug to release continuously for 24 hrs. The studies, therefore, indicate the successful formulation development of NPs with distinctly improved bioavailability potential and can be used as drug carrier for sustained or prolonged drug release.
Keywords: Atazanavir, Nanoparticles, Chitosan, In-vitro
INTRODUCTION
The majority of recently discovered chemical entities are poorly soluble in water [1-3]. Enhancing the oral bioavailability of these poorly water-soluble compounds is of immense attention to the scientific community and a key area of pharmaceutical research. One of the most extensively studied strategies in this regard is nanotechnology [4-6] because of the ability of NPs to pass multiple biological barriers and to release a therapeutic compound within the optimal dosage range. NPs appear to be promising tools for delivery of poorly soluble drugs, yet few have been commercialized [7]. NPs provide the possibility of achieving high drug-loading capacity, sustained release, enhanced drug stability and absorption, as well as targeted deposition [8]. NPs protect the entrapped drug from gastrointestinal interferences, prolong the systemic circulation time and control the release of drug in blood [9]. All these benefits can contribute to reduction of dose and dosing frequency, thereby reducing the side effects and ameliorating the patient compliance. Antiviral therapy requires high, prolonged plasma and tissue drug levels, where viral replication could be controlled. NPs potentially provide more durable control of viral replication in plasma, therefore maintaining long-term efficacy of the regimen [10]. ATV is an azapeptide compound and the seventh addition to the family of HIV protease inhibitor (PIs) and is the most important drug among the other PIs recommended by World Health Organization (WHO) for the management of all forms of HIV [11]. ATV has been successfully used in treatment-native and experienced HIV patients [12]. ATV belongs to Biopharmaceutics Classification System (BCS) class II drug with poor water solubility and high permeability (log P of 4.11) [13]. In adults, ATV recommended therapeutic dose is 400 mg once a day (QD). Besides these, it undergoes rapid first-pass metabolism and P-gp efflux, leading eventually to marked reduction in the drug oral bioavailable fraction (i.e. 60%) in humans and animals like rats, etc. [14]. To circumvent the aforementioned limitations various formulation approaches of ATV have been reported like, Nano crystals, [15] tablets and capsules [16] but all with limited fruition. It has been well reported in the literature that daily dose of ATV causes serious liver problems, specifically hepatotoxicity [17]. As a shortfall for all the conventional oral dosage forms, the duration of action is limited since the absorption of the drug depends on the resident time of the drug in the gastrointestinal tract. In order to fulfill the need of a long-term treatment with anti HIV agents, where most of them suffer from the shortcoming of frequent administration and plasma concentration fluctuation, it is desirable to have novel drug-delivery carriers such as NPs [18, 19].
MATERIALS AND EQUIPMENTS
Atazanavir was provided by Sigma Aldrich Pvt. Ltd. Tween and Chitosan also (M.W. = 140 kDa, 85% deacetylated) was provided by Sigma Aldrich Pvt. Ltd. Acetic acid was provided by Himedia Laboratories Pvt. Ltd. UV Visible Spectroscopy (Schimadzu 1710), Sonicator (LOBO life 2500ml Sonicator), Electronic balance (Metler Toledo AG 135), DSC (Schimadzu DSC-60), Particle size analyser (Malveran master sizer) and Scanning electon microscopy (Delmic BV) was used.
Preformulation Studies [20, 21]
Organoleptic Properties
The organoleptic character of the drug like color, odour and appearance play an important role in the identification of the sample and hence they should be recorded in descriptive terminology.
Solubility Studies
It is important to know about the solubility characteristics of a drug in aqueous systems, since they must possess some limited aqueous solubility to elicit a therapeutic response. Solubility was carried out in phosphate buffer pH 6.8, dimethyl formamide and DMSO. Excess of drug was successively added to buffer pH 6.8, dimethyl formamide and DMSO.
Melting point - Melting point of drug is determined using melting point apparatus.
UV Spectroscopy
Preparation a solution of Atazanavir for calibration curve in pH 1.2, pH 7.4 and pH 6.8 buffer solutions:
An accurately weighed amount of Atazanavir 100mg was dissolved in small volume of buffer solutions in each of three 100ml volumetric flask and the volume was adjusted to 100ml with 1.2 pH buffer in first volumetric flask, 7.4 pH buffer in second volumetric flask and the third one was adjusted to 100ml with 6.8 pH buffer. A series of standard solution containing in the concentration range from 10 to 50 µg/ml of Atazanavir were prepared for 1.2 pH buffer solution, 7.4 pH buffer solution and 6.8 pH buffer solution separately, absorbance was measured at 278nm and calibration graph was plotted using concentration versus absorbance.
Drug-excipient compatibility study by Differential scanning calorimetry (DSC):
Samples of individual compounds as well as each drug-excipient were weighed (Mettle Electronic Balance) directly in pierced aluminum crucible pans (5-10mg) and scanned in the 50-300˚C temperature range under static air, with heating rate of 10 c/min, using shimadzu DSC-60 equipment.
Method
Preparation of atazanavir nanoparticles by emulsion - droplet coalescence method:
Chitosan was dissolved in 1% acetic acid and 100 mg of Atazanavir in phosphate buffered saline. This solution was added to 10 ml of liquid paraffin containing 2% v/v tween 20. This mixture was stirred using a homogenizer 3 minutes to form water in oil (w/o) emulsion. The resultant Atazanavir nanoparticles were centrifuged at 3000 rpm for 60 min and washed using ethanol and water, consecutively to remove the remaining surfactant and liquid paraffin. Later they were dried in air for 3 hour followed by hot air oven at 50° for 4 hour and stored in a dessicator. Several batches namely (AZNP1, AZNP2, AZNP3, AZNP4 and AZNP5) were formulated by changing the drug and polymeric ratio and the effect of polymer concentration on the encapsulation efficiency and the drug loading capacity was studied.
Table 1: Formula used for the preparation of Atazanavir nanoparticles
|
S.NO |
FORMULATION |
DRUG (mg) |
CHITOSAN (%W/V) |
TWEEN (%V/V) |
|
1. |
AZNP1 |
100mg |
0.25 |
2 |
|
2. |
AZNP2 |
100mg |
0.50 |
2 |
|
3. |
AZNP3 |
100mg |
0.75 |
2 |
|
4. |
AZNP4 |
100mg |
1.0 |
2 |
|
5. |
AZNP5 |
100mg |
1.25 |
2 |
CHARACTERIZATION STUDIES [22,23]
Particle Size and Surface Charge
Surface charge is important in adhesion and interaction of particle with cells. The Zeta potential is used to measure the cell surface charge density. It can be measured using Malven-Zetasizer. The prepared nanoparticles were evaluated for their particle size and surface charge by photon correlation spectroscopy (PCS) using Zeta sizer. The formulations were diluted to 1:1000 with the aqueous phase of the formulation to get a suitable kilo counts per seconds (Kcps). Analysis was carried out at 25˚C with an angle of detection of 90˚. In this experiment 6 replicates were taken for the measurement. The results were given in results and discussion section.
Drug Content
1gm of Atazanavir SLNs were accurately weighed and transferred into a 25ml volumetric standard flask. The sample was dissolved with pH 6.8 phosphate buffer solution. 1ml of this solution was diluted to 25ml with the same buffer solution. The standard Atazanavir was dissolved and diluted with same buffer solution. Then the standard and sample absorbance was measured at 278nm using UV-Visible spectrophotometer. The percentage of drug contact was calculated. The results were given in results and discussion section.
Entrapment Efficiency
The drug loaded nanoparticles in buffer solutions were subjected to centrifugation at 15000 rpm for 30 minutes. The supernatant liquid was separated and 1ml of this solution was diluted with buffer solution and the absorbance was measured at 278nm. The amount of Atazanavir unentrapped in the supernatant was calculated. The amount of Atazanavir entrapped was determined by subtracting amount of free unentrapped Atazanavir from the total amount of Atazanavir taken for preparation.
In vitro Release
In vitro release studies were performed for 24h using dialysis membrane by using the Franz diffusion cell. The prepared Atazanavir nanoparticles were placed inside a dialysismembrane and immersed in pH 6.8 phosphate buffer. At predetermined time intervals the sample was withdrawn and the amount of Atazanavir released was determined by measuring the absorbance at 278nm using a UV visible spectrophotometer. From the absorbance values the cumulative percentage drug release was calculated. The results were given in results and discussion section.
RESULTS
Physical parameters were analyzed of Atazanavir drug, individual drug and excipients and drug-excipient mixture table no. 2, table no. 3 and table no. 4 respectively. Standard calibration curve of Atazanavir was carried out in 1.2 pH, 7.2 pH and 6.8 pH buffer at 278 nm. Absorbance of Atazanavir in buffer solutions was given in table no. 5 and Calibration curve of Atazanavir in pH 1.2, 7.2 and 6.8 buffers was shown in figure 1. The r2 value in the entire medium shows nearly 1, which signifies linearity. Particle size of optimized Atazanavir nanoparticles (AZNP3) was shown in figure 2. Zeta potential of optimized Atazanavir nanoparticles (AZNP3) was shown in figure 3. Particle size and entrapment efficiency of the Atazanavir nanoparticles (AZNP1-AZNP5) were increased with increasing Chitosan concentration.
Table 2: Physical characteristics of Atazanavir.
|
S.No |
Physical parameters |
Results |
|
1 |
Description |
White crystalline powder |
|
2 |
Melting point |
199°C |
|
3 |
Loss on drying |
0.18% |
|
4 |
Assay |
99.86% |
Table 3: Physical characteristics of individual drug and excipients.
|
S.No |
Sample ID |
Initial description |
Final description |
|
1. |
Atazanavir |
White crystalline powder |
No change |
|
2. |
Chitosan |
Off white powder |
No change |
Table 4 Physical characteristics of drug-excipient mixture.
|
S.No |
Sample ID |
Initial description |
Final description |
|
1 |
Atazanavir |
White crystalline powder |
No change |
|
2 |
Atazanavir + Chitosan |
Off white powder |
No change |
Table 5: Absorbance of Atazanavir in buffer solutions.
|
S. no |
Concentration |
Absorbance |
||
|
pH 1.2 |
pH 7.2 |
pH 6.8 |
||
|
1 |
10 |
0.025 |
0.036 |
0.040 |
|
2 |
20 |
0.052 |
0.073 |
0.081 |
|
3 |
30 |
0.076 |
0.108 |
0.122 |
|
4 |
40 |
0.101 |
0.146 |
0.163 |
|
5 |
50 |
0.125 |
0.182 |
0.204 |
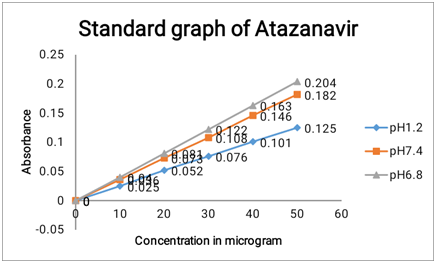
Figure 1: Calibration curve of Atazanavir in pH 1.2, 7.2 and 6.8 buffers.
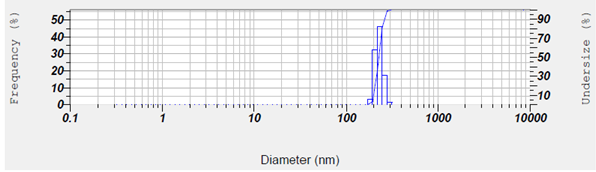
Figure 2: Particle size of optimized Atazanavir nanoparticles (AZNP3).
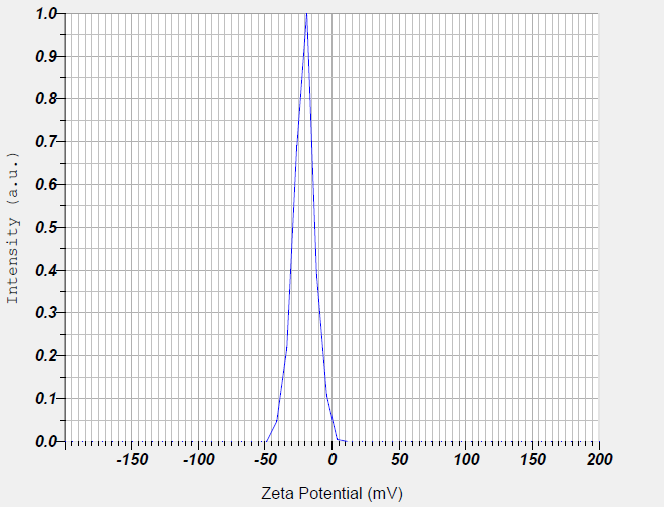
Figure 3: Zeta potential of optimized Atazanavir nanoparticles (AZNP3).
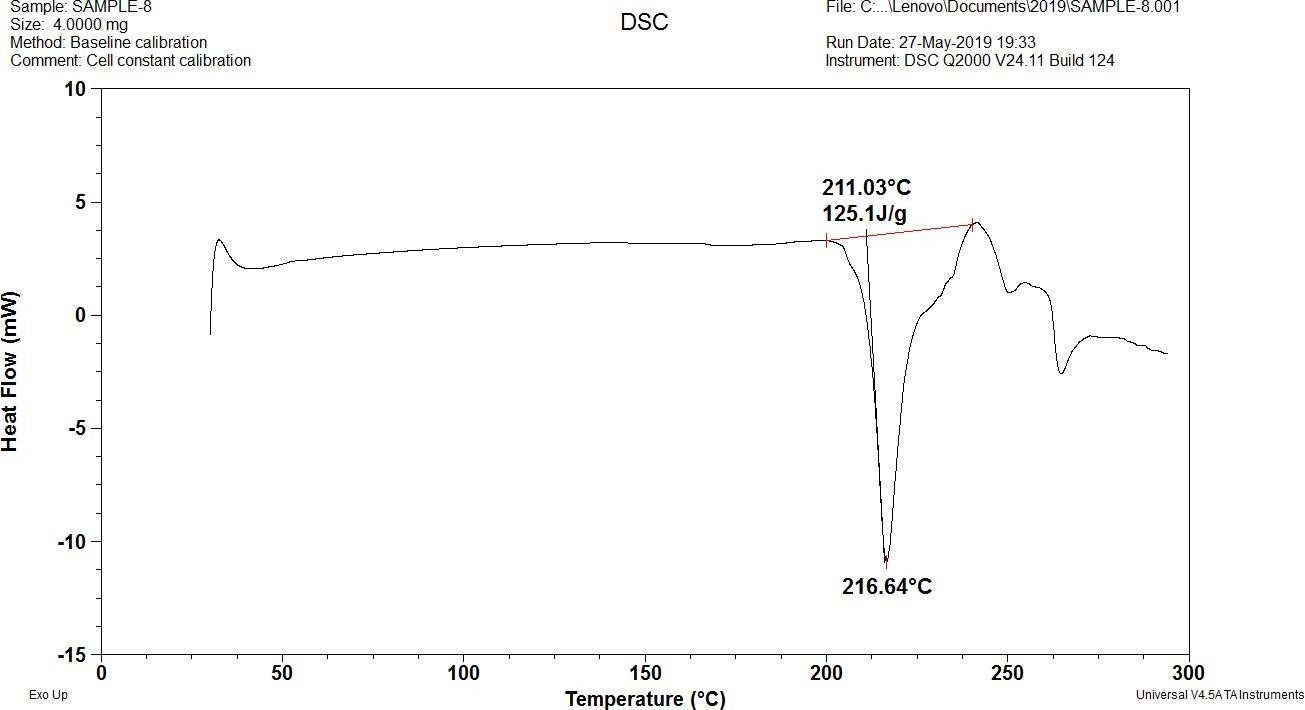
Figure 4: DSC Thermogram of Atazanavir.
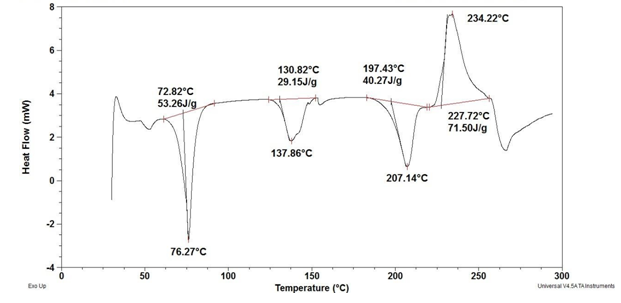
Figure 5: DSC Thermogram of Atazanavir nanoparticles.
Table 6: Drug content and entrapment efficiency Particle size and zeta potential of Atazanavir nanoparticles.
|
Trials |
Zeta potential (mV) |
Particle size(nm) |
Entrapment Efficiency (%) |
Drug Content (%) |
|
AZNP1 |
-17.7 |
211.6 |
55.76 |
99.85 |
|
AZNP2 |
-18.6 |
220.3 |
62.19 |
99.79 |
|
AZNP3 |
-20.7 |
227.9 |
85.65 |
99.86 |
|
AZNP4 |
-21.4 |
250.8 |
85.71 |
99.82 |
|
AZNP5 |
-22.7 |
276.8 |
86.2 |
99.84 |
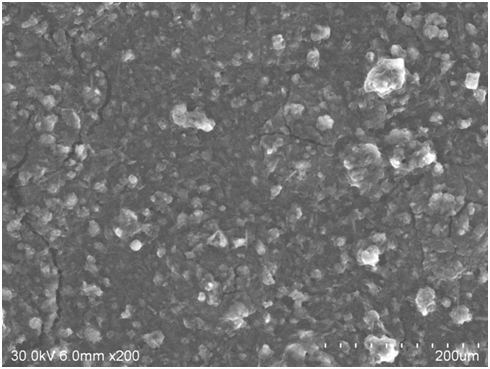
Figure 6: SEM image of Atazanavir nanoparticles (AZNP3).
Table 7: In vitro release studies of Atazanavir nanoparticles.
|
S.NO |
Time (Hrs) |
%Cumulative Drug Release |
||||
|
AZNP 1 |
AZNP 2 |
AZNP 3 |
AZNP 4 |
AZNP 5 |
||
|
1 |
0 |
0 |
0 |
0 |
0 |
0 |
|
2 |
0.5 |
25.57 |
20.13 |
15.82 |
10.16 |
8.53 |
|
3 |
1 |
32.68 |
26.83 |
21.69 |
15.87 |
12.72 |
|
4 |
6 |
67.84 |
62.27 |
57.26 |
25.89 |
20.77 |
|
5 |
12 |
85.81 |
79.45 |
71.49 |
38.48 |
33.85 |
|
6 |
16 |
99.81 |
90.55 |
85.28 |
55.29 |
47.91 |
|
7 |
20 |
99.80 |
99.82 |
94.33 |
68.26 |
59.42 |
|
8 |
24 |
99.79 |
99.81 |
99.85 |
82.67 |
73.39 |
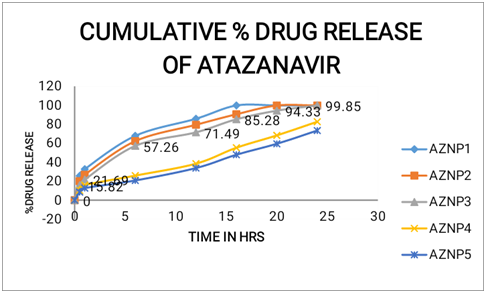
Figure 7: In vitro release studies of Atazanavir nanoparticles.
DISCUSSION
Particle size and entrapment efficiency of the Atazanavir nanoparticles (AZNP1-AZNP5) were increased with increasing Chitosan concentration. This may be due to high amount of availability of Chitosan to encapsulate the drug, upon increasing the Chitosan concentration, number of layers coated the drug was increased; this resulted in increased particle size and entrapment efficiency. Further increase in the Chitosan concentration, there was no much increase in the entrapment efficiency due to the availability of the drug to be incorporated is low which is not enough for further encapsulation of drug by chitosan. DSC Thermogram of Atazanavir and Atazanavir nanoparticles Drug–Excipients accelerated compatibility study-Physical observation and assay were shown in fig. 4 and fig. 5 respectively. DSC of Atazanavir showed a sharp endothermic peak at about 211˚C (melting point). The physical mixture of Atazanavir with other excipients also showed the same thermal behavior (207˚C) as the individual component. DSC results also revealed that the physical mixture of Atazanavir with excipients showed superimposition of the thermogram. There was no significant change observed in melting endotherm of physical mixture of Atazanavir and excipients. Hence from the DSC study, it was found that there was no interaction between Atazanavir and other excipients used in the formulation. Upon analysis of the drug excipient mixture for their physical characteristics, no colour change was observed. Based on the chemical evaluation it was found that there was no significant change observed indicating that the drug is compatible with the added ingredients. Drug content and entrapment efficiency Particle size and zeta potential of Atazanavir nanoparticles was shown in table no. 6. The results of SEM analysis confirm the prepared nanoparticles were spherical in shape and nano in size and shown in fig. 6. From the in vitro drug release study results was shown in table no. 7 and fig 7, the maximum percentage drug release 99.85% at the end of 24hwas observed with trial AZNP3 which contains 100mg of drug and 0.75%w/v of Chitosan and 2% w/v of tween 80. Below 0.75%w/v concentration of Chitosan as in the case of trials AZNP1 and AZNP2 the maximum percentage drug release 99.81 and 99.82 were obtained at the end of 16 and 20 respectively which was not desirable. Above 0.75%w/v concentration of Chitosan, reduction in drug release was observed as in the case of trial AZNP3-AZNP5. The maximum percentage drug release for AZNP3 was found to be 99.85 at the end of 24h was obtained. From the in vitro drug release data for AZNP1- AZNP5, it was observed that increase in Chitosan concentration delays the drug release due to increased particle size and reduced surface area of the prepared nanoparticles. From all the formulations, AZNP3 was selected as best formulation due to its ideal particle size (227.9 nm), Zeta potential (-20.7), high entrapment efficiency (85.65%) and desirable drug release 99.85% at the end of 24 h.
SUMMARY AND CONCLUSIONS
The active pharmaceutical ingredient Atazanavir was evaluated for its organoleptic properties and solubility. The results obtained were satisfactory. Atazanavir nanoparticles were prepared and the polymer concentrations were optimized by various trials. In the present study, Chitosan nanoparticles containing Atazanavir were prepared. The effect of increase in Chitosan concentration on various parameters like particle size, zeta potential and in vitro release profile were studied. The Atazanavir nanoparticles were formulated and evaluated for its in vitro drug release profile. The results showed that the in vitro drug release for AZNP1, AZNP2, AZNP3, AZNP4 and AZNP5 were found to be 99.81, 99.82, 99.85, 82.67 and respectively at the end of 24hrs. Based on the drug content, entrapment efficiency, particle size, zeta potential and in vitro drug release profile of Atazanavir nanoparticles formulations formulation AZNP3 was selected as the best formulation in which the particle size was 227.9nm. The in vitro % drug release of AZNP3 formulation was 99.85% and it was found to be suitable formulation to manage the condition of HIV. Hence it can be concluded that the newly formulated controlled release nanoparticulate drug delivery systems of Atazanavir may be ideal and effective in the management of HIV by allowing the drug to release continuously for 24 hrs.
REFERENCES
- Al-Qadi S, Grenha A, Carrión-Recio D, Seijo B, Remuñán-López C. (2012). Microencapsulated chitosan nanoparticles for pulmonary protein delivery: in vivo evaluation of insulin-loaded formulations. J Control Release 157:383–390.
- Baba K, Tanaka Y, Kubota A, Kasai H, Yokokura S, Nakanishi H, et al. (2011). A method for enhancing the ocular penetration of eye drops using nanoparticles of hydrolysable dye. J Control Release 153:278–287.
- Balkundi S, Nowacek AS, Veerubhotla RS, Chen H, Martinez-Skinner A, Roy U, et al. (2011). Comparative manufacture and cell based delivery of antiretroviral nano formulations. Int J Nanomedicine. 6:3393–3404.
- Beloqui A, Solinís MÁ, Gascón AR, del Pozo-Rodríguez A, des Rieux A, Préat V. (2013). Mechanism of transport of saquinavir-loaded nanostructured lipid carriers across the intestinal barrier. J Control Release 166:115–123.
- Bender AR, Von Briesen H, Kreuter J, Duncan IB, Rubsamen-Waigmann H. (1996). Efficiency of nanoparticles as a carrier system for antiviral agents in human immunodeficiency virus-infected human monocytes/ macrophages in vitro. Antimicrob Agents Chemother 4:1467–1471.
- Benet LZ, Broccatelli F, Oprea TI. (2011). BDDCS applied to over 900 drugs. AAPS J 13:519–547.
- Dahan A, Hoffman A. (2007). The effect of different lipid based formulations on the oral absorption of lipophilic drugs: the ability of in vitro lipolysis and consecutive ex vivo intestinal permeability data to predict in vivo bioavailability in rats. Eur J Pharm Biopharm. 67:96–105.
- Dodiya SS, Chavhan SS, Sawant KK, Korde AG. (2011). Solid lipid nanoparticles and nanosuspension formulation of Saquinavir: preparation, characterization, pharmacokinetics and biodistribution studies. J Microencapsul. 28:515–527.
- Devi KV, Pai RS. (2006). Antiretrovirals: need for an effective drug delivery. Indian J Pharm Sci 68:1–6.
- Ensign LM, Cone R, Hanes J. (2012). Oral drug delivery with polymeric nanoparticles: the gastrointestinal mucus barriers. Adv Drug Deliv Rev 64:557–570.
- Jain S, Kirar M, Bindeliya M, Sen L, Soni M, Shan M, et al. (2022). Novel Drug Delivery Systems: An Overview, Asian Journal of Dental and Health Sciences. 2(1):33-39.
- Fagerholm U, Johansson M, Lennernas H. (1996). Comparison between permeability coefficients in rat and human jejunum. Pharm Res 13:1336–1342.
- Fukushima K, Terasaka S, Haraya K, et al. (2007). Pharmaceutical approach to HIV protease inhibitor atazanavir for bioavailability enhancement based on solid dispersion system. Biol Pharm Bull 30: 733–738.
- Gao F, Zhang Z, Bu H, Huang Y, Gao Z, Shen J, et al. (2011). Nanoemulsion improves the oral absorption of candesartan cilexetil in rats: performance and mechanism. J Control Release 149:168–174.
- Ho YF, Lai MY, Yu HY, Huang DK, Hsueh WC, Tsai TH, et al. (2008). Application of rat in situ singlepass intestinal perfusion in the evaluation of presystemic extraction of indinavir under different perfusion rates. J Formos Med Assoc 107:37–45.
- Kawabata Y, Wada K, Nakatani M, Yamada S, Onoue S. et al. (2011). Formulation design for poorly water-soluble drugs based on biopharmaceutics classification system: basic approaches and practical applications. Int J Pharm 420:1–10.
- Lu Y, Kim S, Park K. (2011). In vitro–in vivo correlation: Perspectives on model development. Int J Pharm 418:142–148.
- Mastan SK, Kumar K. (2010). Influence of atazanavir on the pharmacodynamics and pharmacokinetics of gliclazide in animal models. Int J Diabetes Mellit 2:56–60.
- Merisko-Liversidge EM, Liversidge GG. (2008). Drug nanoparticles: formulating poorly water-soluble compounds. Toxicol Pathol 36:43–48.
- Merisko-Liversidge EM, Liversidge GG. (2011). Nanosizing for oral and parenteral drug delivery: a perspective on formulating poorly-water soluble compounds using wet media milling technology. Adv. Drug Deliv Rev 63:427–440.
- Mora-Huertas CE, Fessi H, Elaissari A. (2010). Polymer-based nanocapsules for drug delivery. Int J Pharm 385:113–142.
- Norris DA, Puri N, Sinko PJ. (1998). The effect of physical barriers and properties on the oral absorption of particulates. Adv Drug Deliv Rev 34:135–154.
- Jain P, Nair S, Jain N, Jain DK, Jain S. (2012). Formulation and evaluation of solid dispersion of lomefloxacin hydrochloride. Int J Res Pharm Sci. 3(4):604-608.
- Pandey SP, Khan MA, Dhote V, Dhote K, Jain DK. (2019). Formulation development of sustained release matrix tablet containing metformin hydrochloride and study of various factors affecting dissolution rate. Scholars Academic J Pharm. 8(3):57-73.
- Patel AK, Rai JP, Jain DK, Banweer JI. (2012). Formulation, development and evaluation of cefaclor extended release matrix tablet. Int J Pharm Pharm Sci. 4(4):355-357.
- Gautam SP, Rai JP, Billshaiya U, Jain N, Vikram P, Jain DK. (2013). Formulation and evaluation of mouth dissolving tablet of loperamide. Int J Pharm Sci Res. 4(5):1782.